UHF-Band (648-712MHz) Survey
The UHF Survey spectrum plots cover the band associated with the new 50cm Receiver, 648-712MHz, with a centre frequency of 680MHz, bandwidth 64MHz.The survey spectrum plots are measured with the Interference Monitoring System (IMS), apart from the 1st 2 linked images below, which are measured with a spectrum analyser, as part of a demonstration, to show the TV broadcast spectrum that exists near the band of interest, for the 50cm receiver.
The survey spectral plots are given as 3 main plots per view, with the 1st plot covering the full 50cm band of 648-712MHz. Due to the inband response of the Digital TV signal from Mt Ulandra, in the plots, separate narrow-band plots, each of around 30MHz bandwidth, are also given. The 1st of the narrow-band plots is centred at 680MHz, whilst the second narrow-band plot is centred at 700MHz. The narrow-band responses, mean that the dominating effect of the DTV signal is avoided, and weaker signals are allowed to be detailed in the resultant spectral plot.
The spectral plots measured with the IMS, are generated using the Observatory's Interference Analysis program, INTER_HPF, and are an averaged display, typically from an averaged 50 integrations, each integration being of 5 seconds duration.
In the IMS spectral plots detailed below, the scale on the Y-axis needs to be rescaled. To obtain the correct averaged flux Jansky, values should be multiplied by 13E03, thus yielding an averaged spectral flux density noise floor of approximately 5.2MJy
Select a view from below:
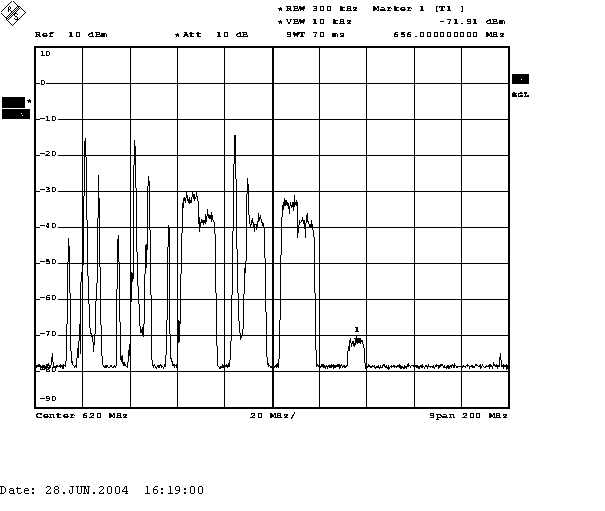
 Broad Band UHF Spectrum with Analogue & Digital TV transmissions. Marker is at centre of CH 46 (652-659MHz), Mt Ulandra.
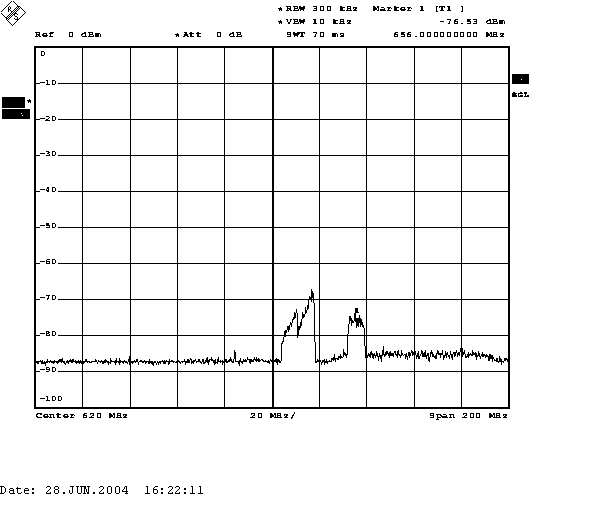
Filtered UHF Spectrum shows the response of the 50cm receiver RF module band-pass-filter, on the TV transmissions. Note:CH 46 is on the lower edge of the in-band filter response.
View North
View North East
View East
View South East
View South
View South West
View West
View North West
Spectrum Notes Detailed information pertaining to RFI arising from the survey