Coherent IMS Modulation Analyzer (CIMSMA)
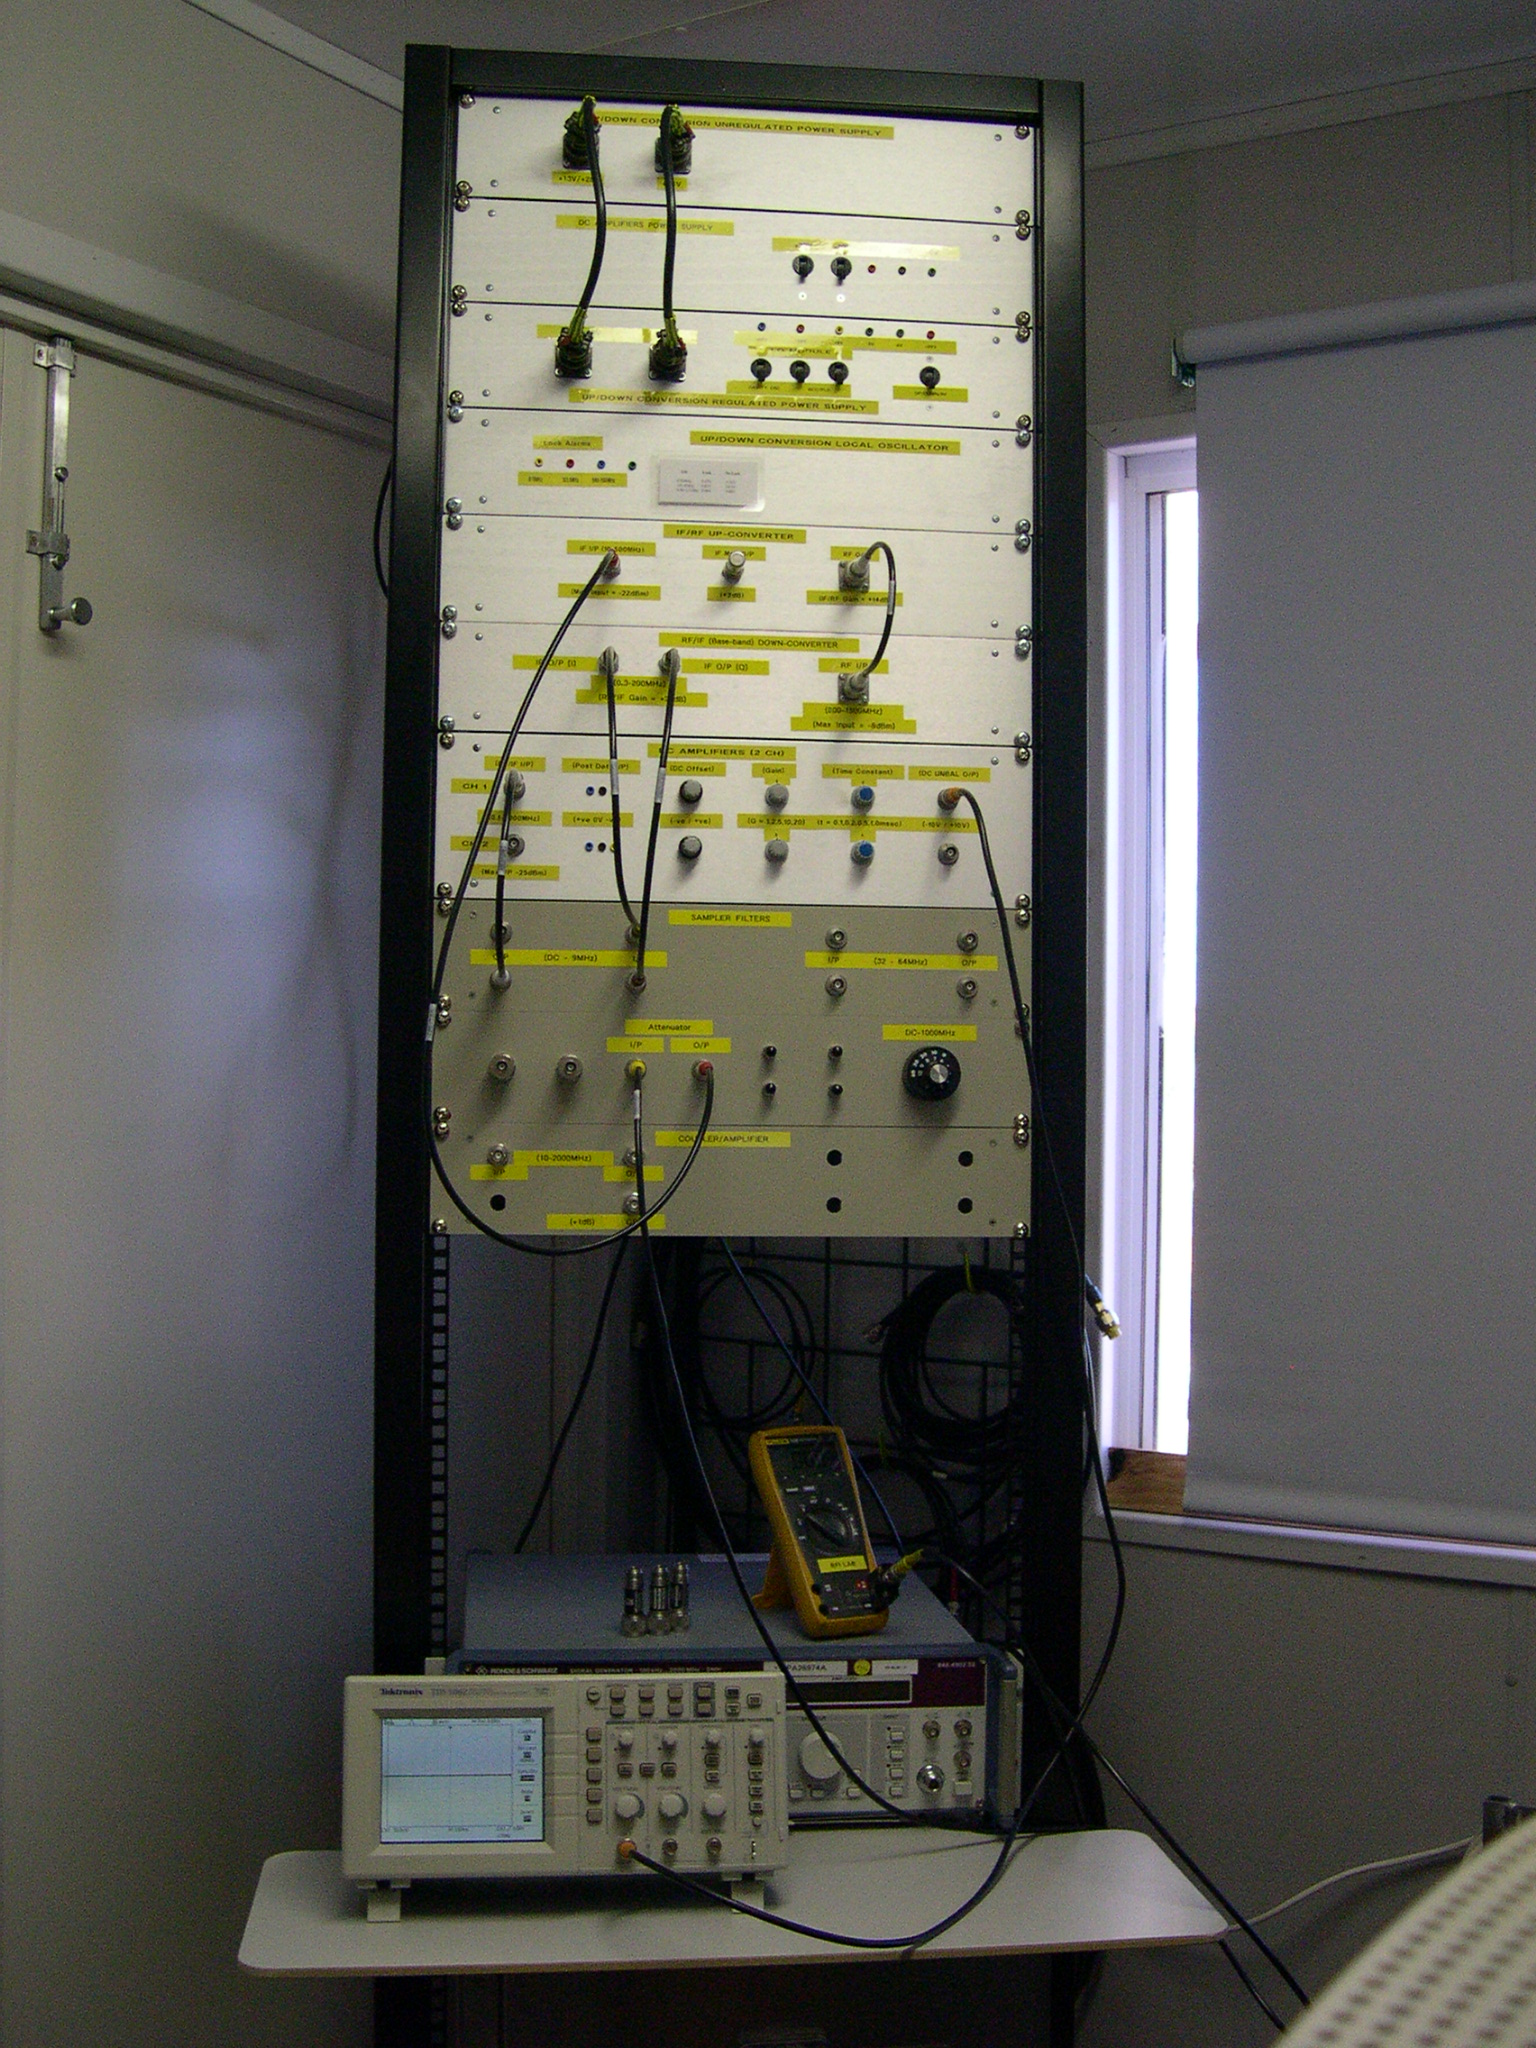
The Coherent IMS Modulation Analyzer (CIMSMA) has developed out of a need to be able to measure modulation spectrum, as recorded by the Pulsar observations, here at the observatory. Pulsar observations look for variations in the amplitude of the RF spectrum, as a function of time, and as such, are prone to interference from amplitude modulated signals. The basic premise of the CIMSMA is to take the auxiliary IF spectrum generated from the IMS RF/IF down-conversion system, and through a process of up-conversion, and down-conversion, provide a pair of base-band outputs, from DC-200MHz, as I & Q channels, for coherent signal detection processing, dependent upon the digitizer used. An alternative non-coherent detection process has also been provisioned for, through the use of square law detection scheme, followed by with post-detection DC amplifiers. For the coherent scheme so far developed, a 15MHz analogue bandwidth, 20MSample/sec, 8 bit digitizer, installed in a desktop computer, for waveform capture, and software signal processing, to yield modulation spectrum, is used. Prior to the input to the digitizer card, a set of sampler anti-aliasing filters, DC-9MHz, are used, to constrain the signal for Nyquist sampling. Below is example data from the CIMSMA. The non-coherent detection process requires the use of the detected voltage, suitably filtered, and gain adjusted, as an input to a PicoScope, a dual channel, digitizer, turning the PC into an oscilloscope, and a low frequency spectrum analyzer.
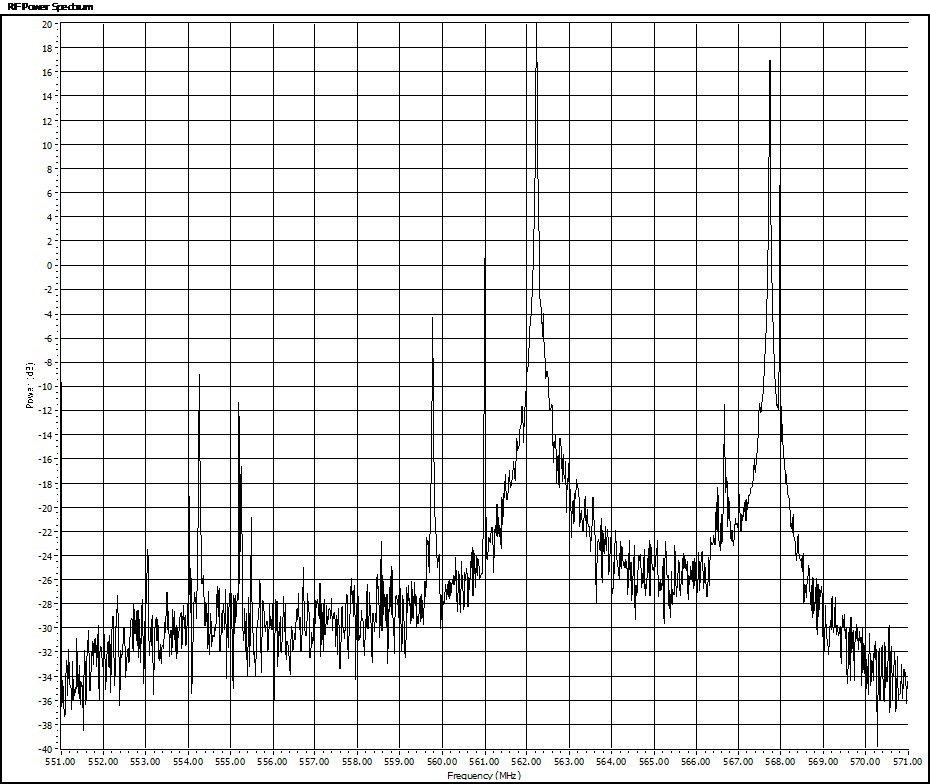
In the example plots given below, 4 particular types of RFI signal have been examined, Analogue TV, Digital TV, Distance Measuring Equipment (DME), and Digital Radio Concentrator Service (DRCS). Radio Frequency Spectrum plots of these signals can be viewed here. Spectrum plots of the above signals taken with the IMS spectral line correlator can be viewed here.
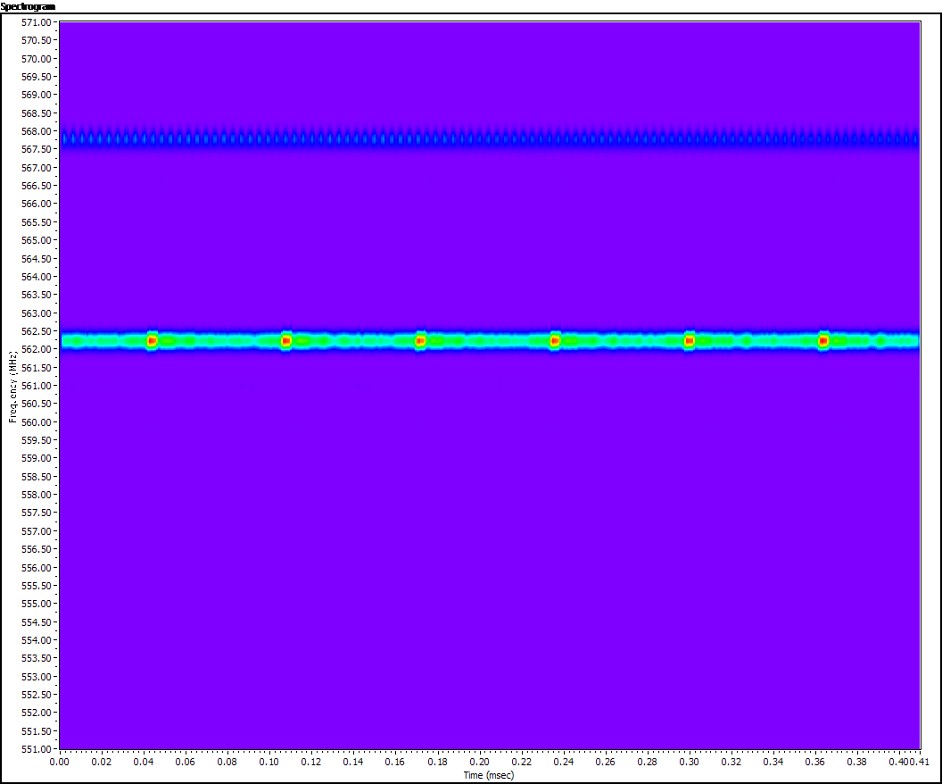
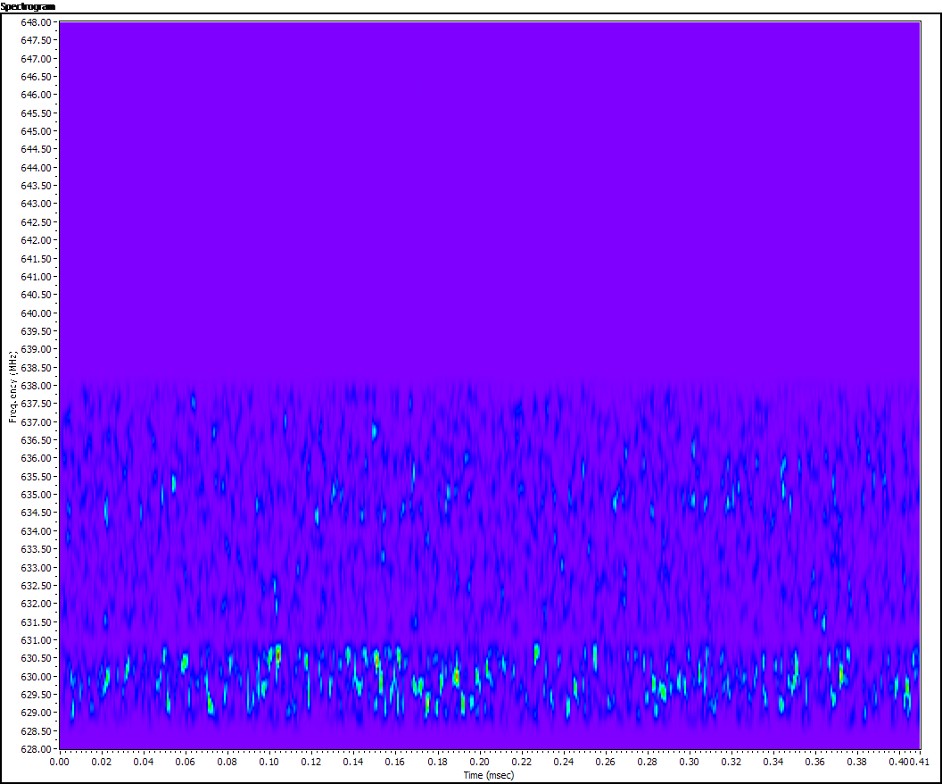
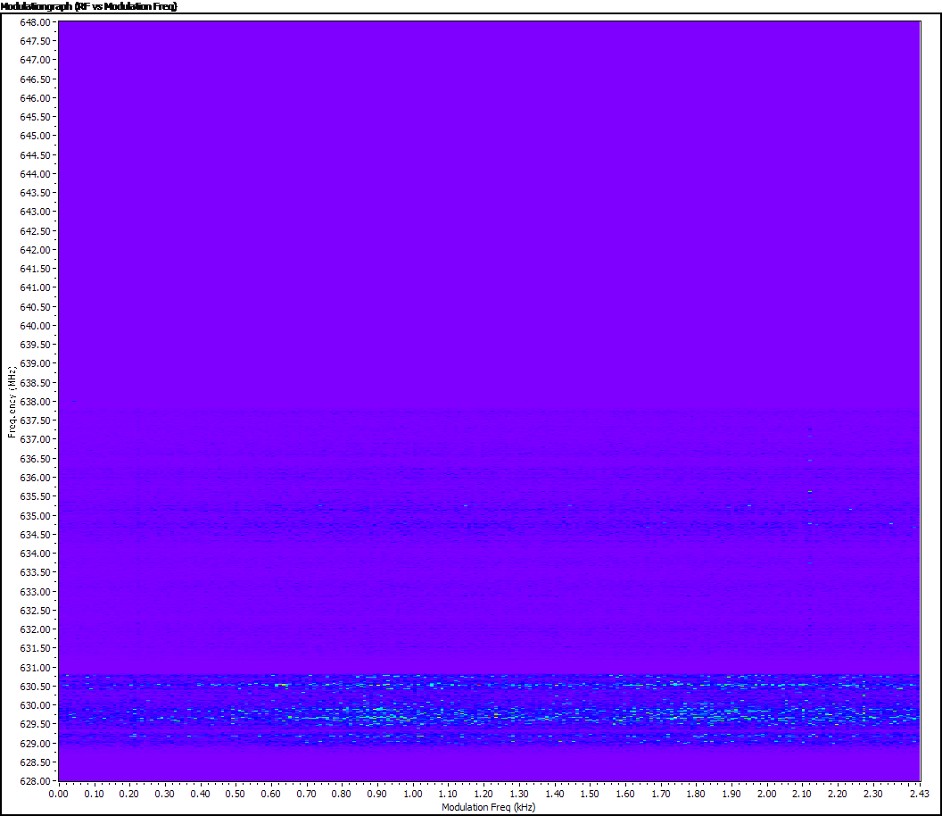
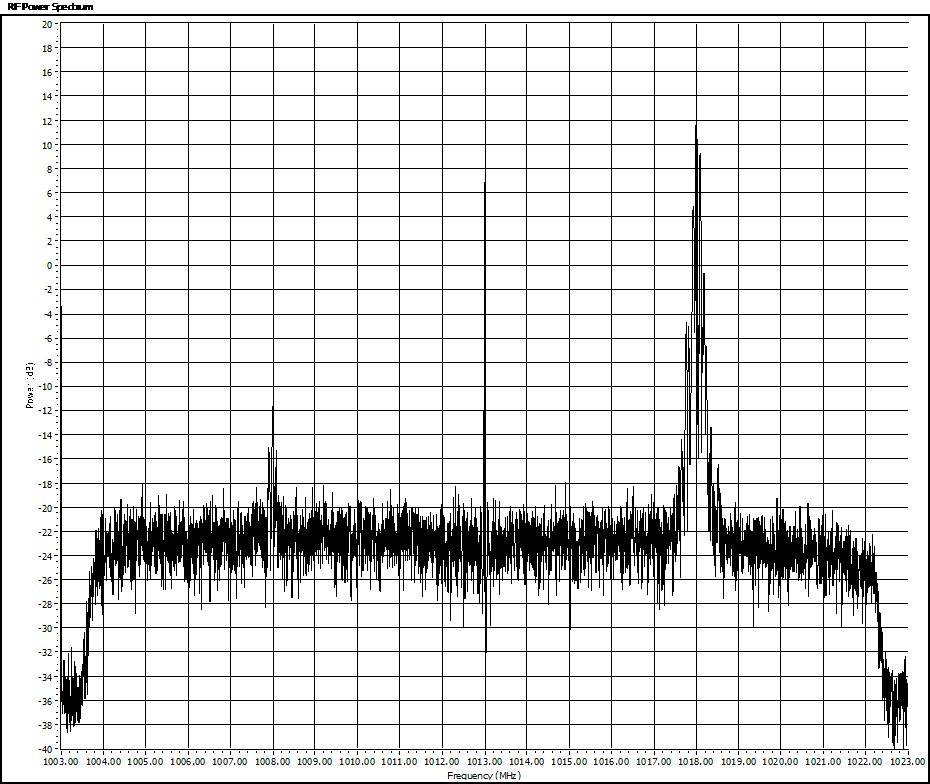
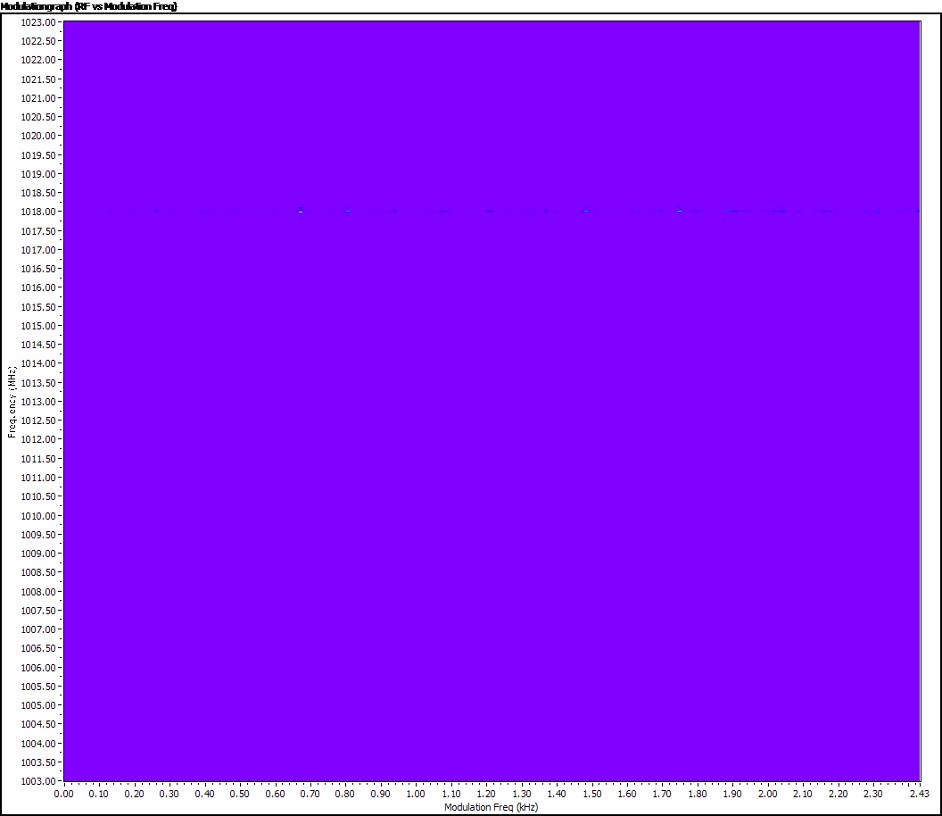
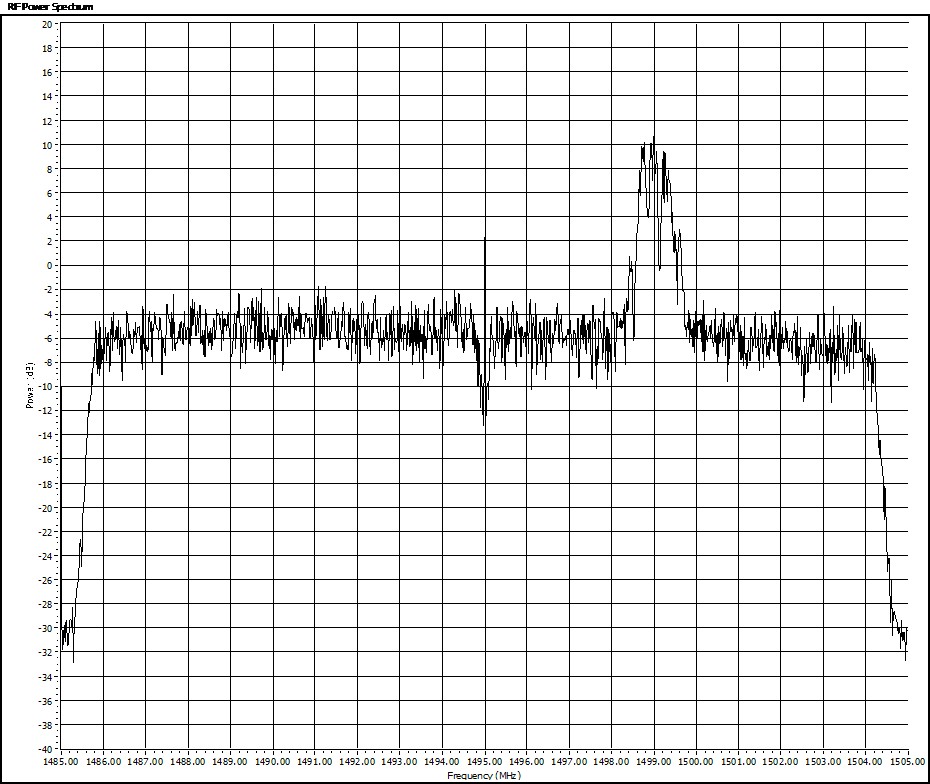
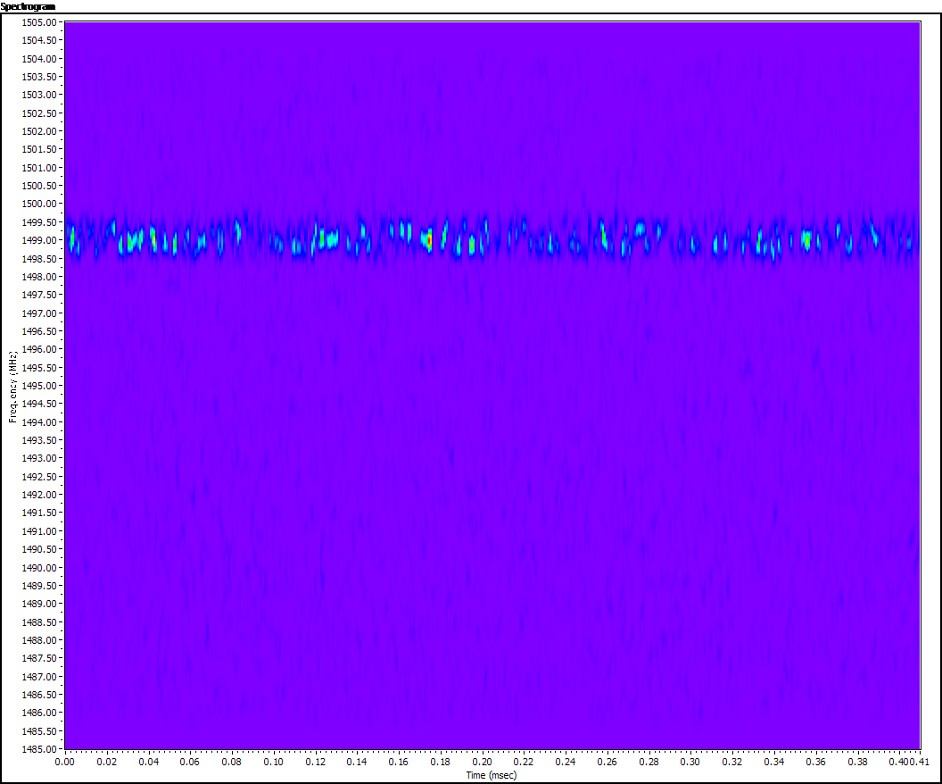
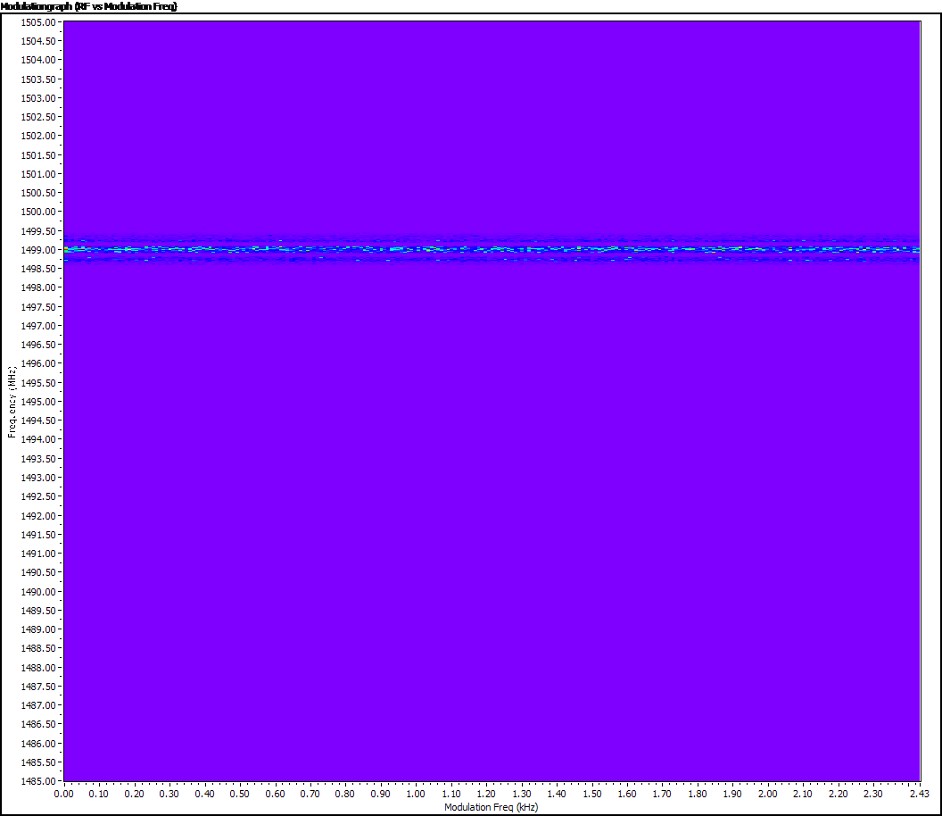
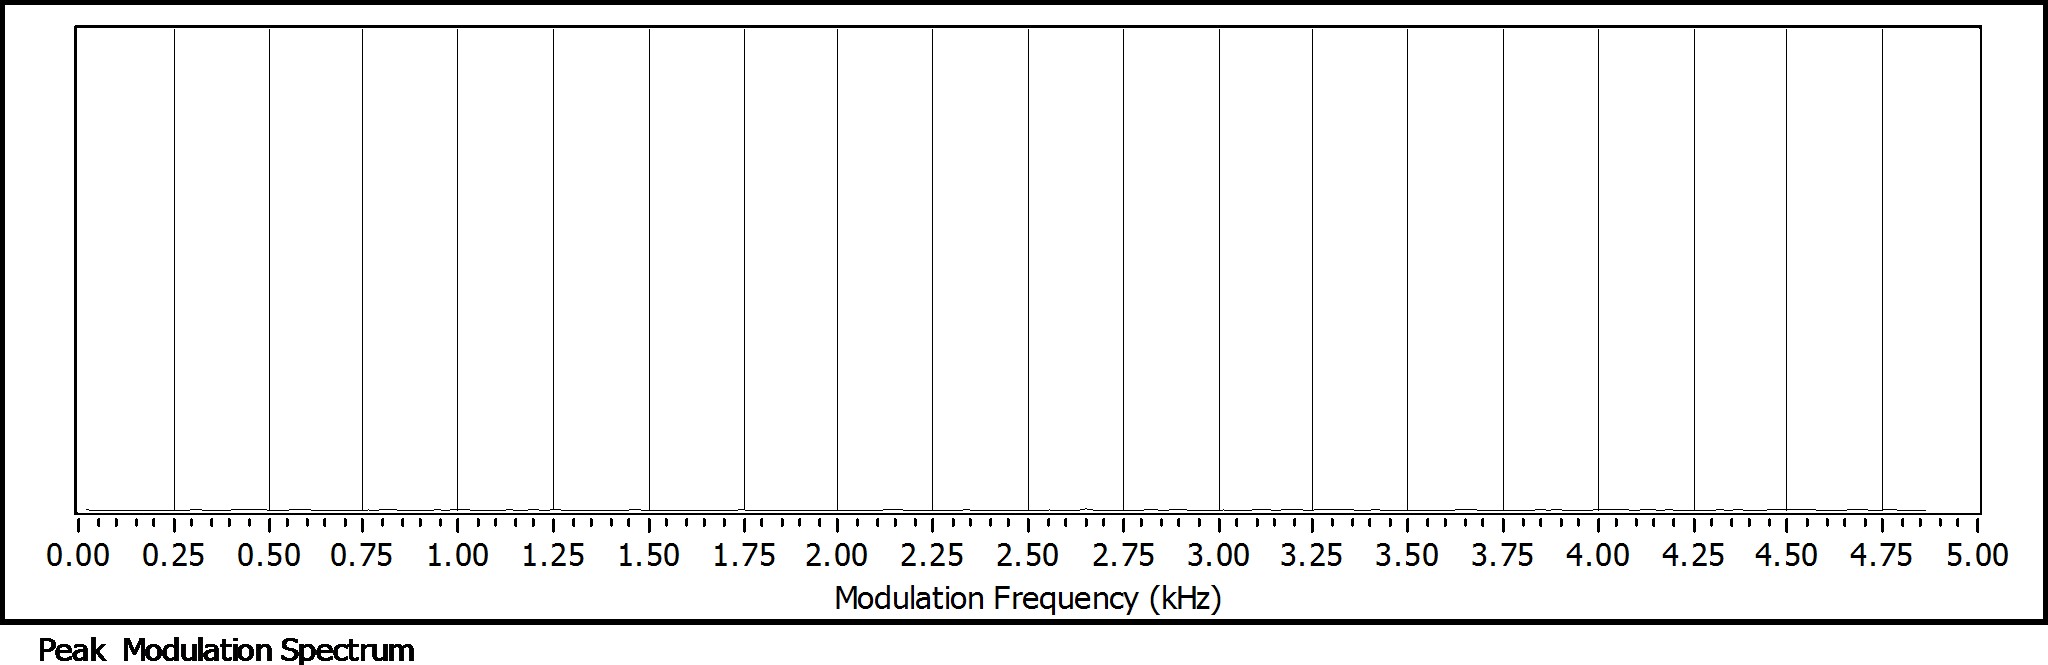
For each RFI signal, plots available include bandpass spectrum (SPECTRUM), intensity spectrogram of bandpass signal (SPECTROGRAM), intensity graph of bandpass spectrum vs modulation spectrum (MODGRAPH), and a peak modulation spectrum (MODULATION).
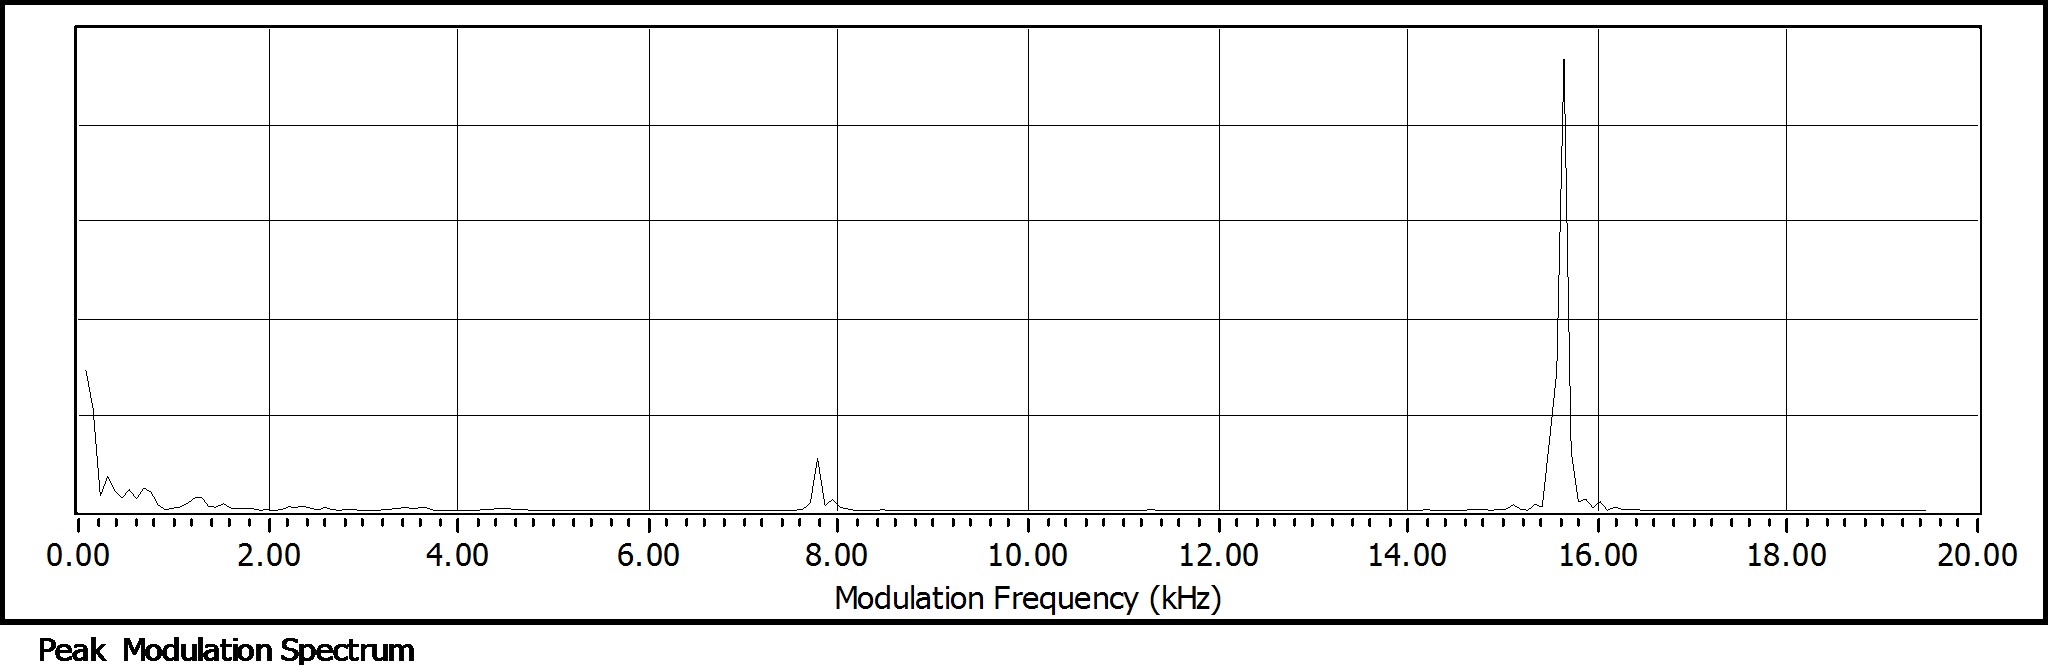
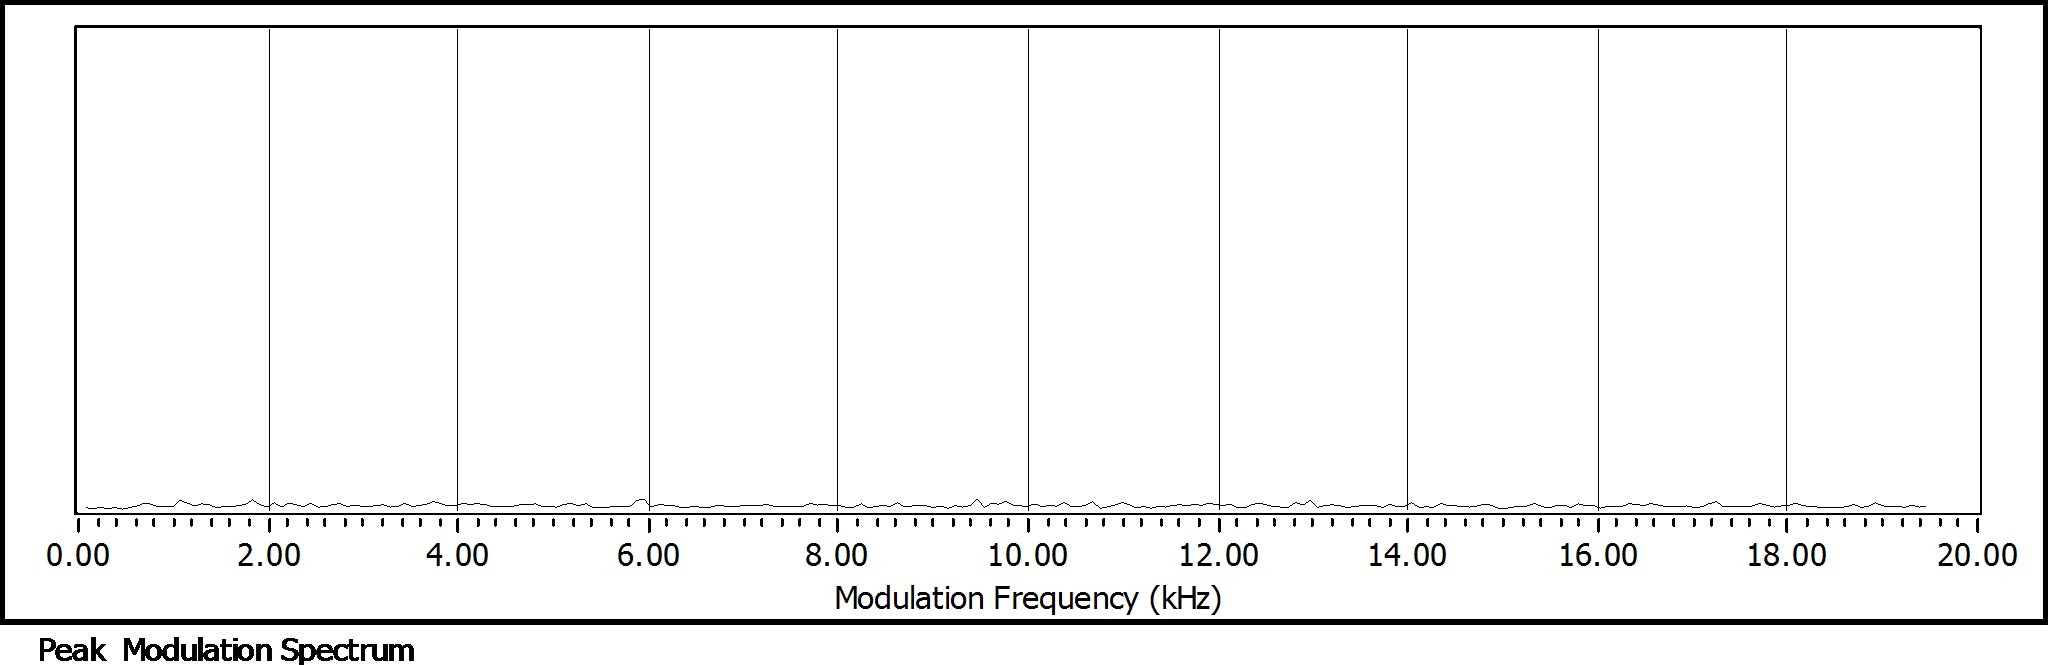
From the analysis of these signals, as sources of RFI for the modulation spectrum, as detected with the various Pulsar observations at the observatory, it is only the Analogue TV and the DME signals which produce a notable signature. The DRCS and DTV provide no visible modulation frequency signatures, but the plots do show, that perhaps, the signals add noise in the respective parts of the RF spectrum, where observations may be happening. For the Analogue TV, the 15.625kHz line frequency of the vision carrier is detected, and for the DME, a harmonic associated with the tone identification transmitter signal for the DME transponder, is detected at 675Hz. The main repetition rate is 1350pps, which is also detected in other modulation spectrum graphs, not shown here.
 Analogue TV SPECTRUM, SPECTROGRAM, MODGRAPH, MODULATION.
Digital TV SPECTRUM, SPECTROGRAM, MODGRAPH, MODULATION.
DME SPECTRUM, SPECTROGRAM, MODGRAPH, MODULATION.
DRCS SPECTRUM, SPECTROGRAM, MODGRAPH, MODULATION.