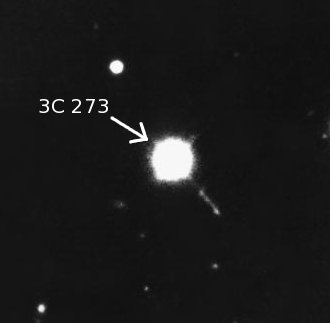
During 1962 a series of lunar occultations of the strong radio source 3C273 were observed by Hazard, Mackey and Shimmins (1963, Nature, 197, 1037) with the newly completed Parkes radio telescope. Analysis of these observations by Hazard gave the position of the two components, A and B, of 3C273 with sub-arcsecond precision. Most importantly the position was given in the optical reference frame, which allowed a unique identification of the optical counterpart. Such arc-second precision had not been achieved previously. It was soon found (Schmidt 1963, Nature, 197, 1040) that component B was coincident with a bright 13th magnitude stellar object, while component A coincided with a faint wisp or jet which ends 20" from B. Schmidt's spectrum of the bright 'star' with the 200-inch telescope found that the only explanation involved a redshift of 0.158 which allowed identification of the Balmer lines of Hydrogen, in addition to emission lines of MgII 2798 and [OIII] 5007. Now with two similar stellar-like objects, 3C48 and 3C273, the possibility of a chance-identification was vanishingly small. These new objects were called "quasars", and the remainder of 1963 saw a dramatic change in our understanding of the Universe.
In the 1950's, the radio astronomy group at Cambridge University, using the Cambridge interferometer, produced several catalogues of celestial radio sources. The third such Cambridge catalogue, published in 1959, detected sources orginally at 159 MHz and later at 178 MHz. References to the entries in this catalgue use the prefix 3C followed by the entry number. For example, 3C 273 is the 273rd entry in the catalogue (ordered by right ascension).
In 1960, the Caltech radio astronomy group, under the directorship of John Bolton, used the then newly commissioned Owens Valley radio interferometer to obtain accurate positions for several of the 3C sources. Using this interferometer, Caltech radio astronomer, Tom Matthews, obtained an accurate position for 3C 48 which John Bolton used to identify a 16th magnitude blue "star" on the plates of the Palomar Sky Survey. This stellar appearance gave rise to the term "radio star". Shortly afterwards, optical astronomers Allan Sandage, Jesse Greenstein and Guido Munch obtained a spectrum of the object with the Mount Palomar 200-inch telescope. The spectral lines were puzzling to the astronomers because they could not identify any hydrogen lines; the spectral lines seemed to defy interpretation. John Bolton was convinced that there was a large red-shift in two of the lines. But, because there was a discrepancy of 4 Angstroms in the fit of the rest of the spectral lines, he was unable to convince his colleagues. The situation remained unresolved until 1963.
In October 1961, the Parkes radio telescope was commissioned and John Bolton returned to Australia to serve as its foundation director.
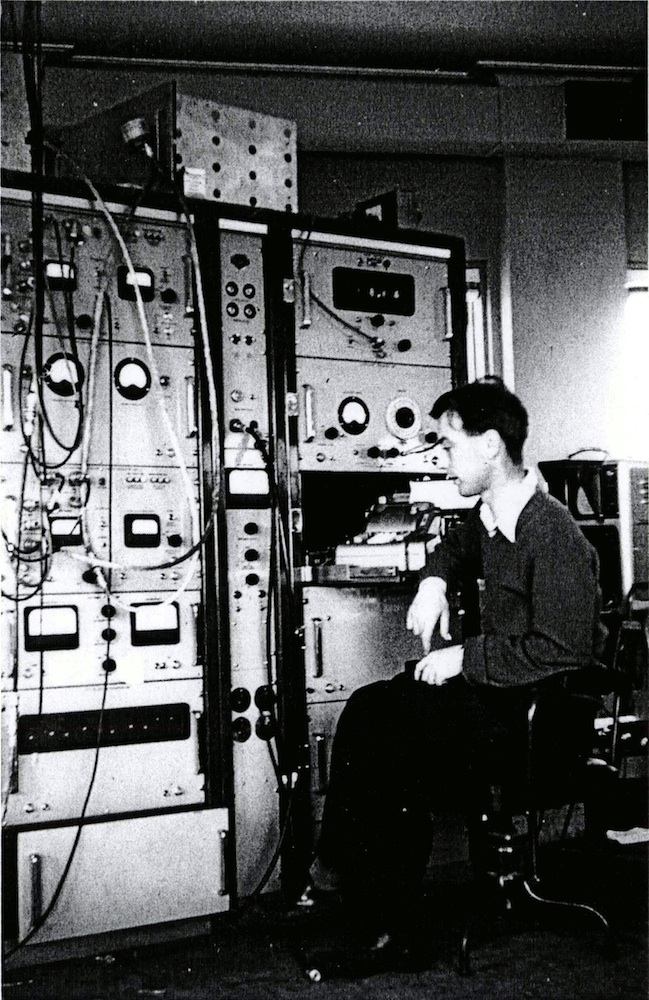
In the 1950's, Cyril Hazard, while studying for his PhD at Jodrell Bank Observatory in the UK, pioneered the method of accurately determining the positions of radio sources using lunar occultations. Since, at any time, the position of the edge of the Moon was accurately known, by timing the disappearance of a radio source behind the Moon and then it's subsequent re-appearance on the other side, the position of the object on the sky could be very accurately determined. This method allowed Hazard to determine the positions of several bright sources, such as 3C 212, to an accuracy of three arc-seconds. In fact, accuracies of better than one arc-second were possible with this method. At the time, this was more accurate than any interferometer operating at the time and was considerably better than any optical resolution. In 1961, Hazard moved to Sydney University to supervise the construction of the Hanbury Brown-Twiss Stellar Interferometer at Narrabri. Later that year, the Parkes telescope was commissioned.
Her Majesty's Nautical Almanac Office in the UK, annually published tables of lunar occultations of bright radio sources for the coming year. In 1962, the radio source, 3C 273, was predicted to be occulted by the Moon on five occasions with three of the occultations visible from Parkes. This series of occultations would occur once every twenty years. Joe Pawsey, the head of astrophysics at the CSIRO Radio Physics Division, invited Hazard to be a guest observer at Parkes to observe these occultations.
The first occultation occured on 15 May 1962. It was the least favorable of the series. The re-emergence of the source (emersion) from behind the Moon was to occur just below the Parkes telescope's 30o elevation horizon (60o zenith angle) as the two were rising at 5:35 PM (AEST).
Parkes engineer, Brian Mackey, setup the observing system and John Shimmins, the deputy director of Parkes, controlled the telescope. During the emersion, the telescope was stationary at its horizon limit waiting for the two to fully rise before it could track them. As the Moon rose into the beam of the stationary telescope, the system noise began to rise resulting in a sloped graph (a gradient in the noise floor). The Fresnel diffraction pattern (the fringes) of the re-emerging source was clearly seen on this plot. Unfortunately, the gradient in the background level made it unsuitable for accurate position measurements because the zero of the curve was uncertain. However, the presence of these clear fringes demonstrated that the source had a small angular size and was strong enough that a very accurate position determination was possible. This meant that good observations of the next two occultations were critically important.
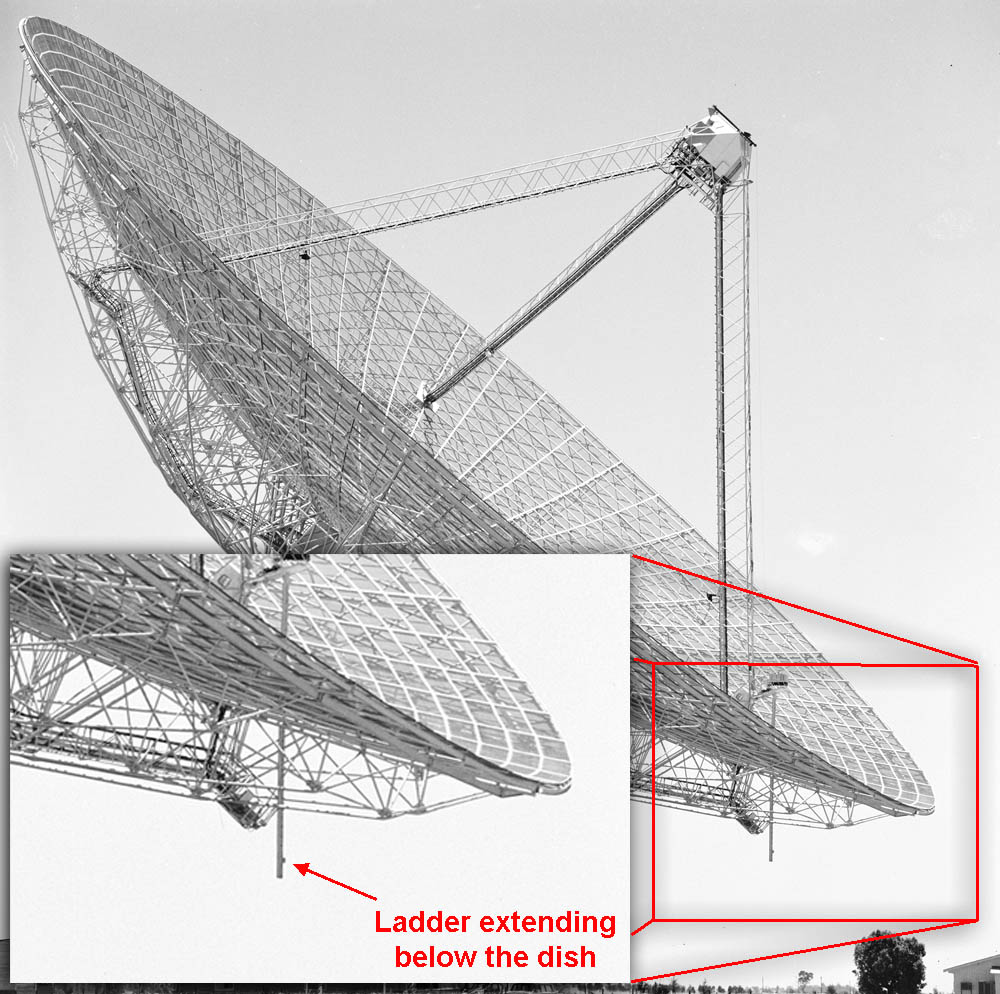
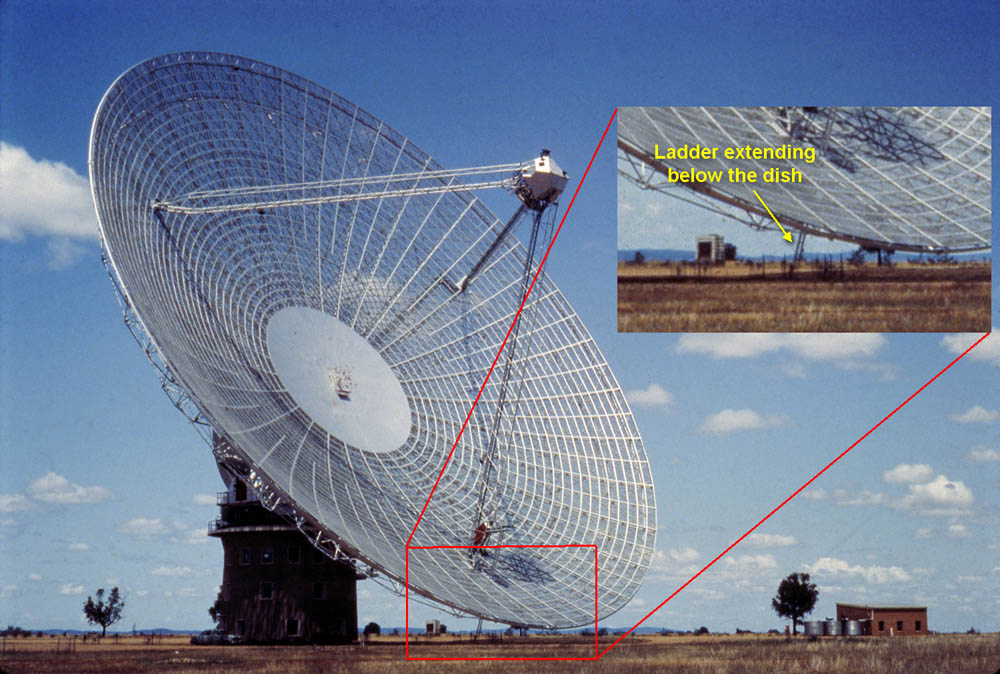
For the next occultation on 5 August 1962, both the disappearance of the source behind the Moon (immersion) and it's re-appearance (emersion) would be visible. The emersion was due to occur very close to the telescope's horizon as the Moon and the source were setting. Due to the uncertainty in the source's position, John Bolton was not taking any chances. He went to extraordinary lengths to ensure the emersion was observed. He cut off sections of a ladder that extended beneath the bottom rim of the dish to allow the dish to tip closer to the ground. He also ground down the ends of the zenith angle bearing housings to allow the dish to tip further still. A trench was also dug around the dish to get it below ground level. In addition, all roads leading to the telescope were closed during the observation, all unnecessary electrical equipment was shut down, and Bolton even arranged for the local radio station to stop transmitting lest it interfere with the observation. Duplicate recording equipment was also setup in case one broke down. As a further precaution, Mal Sinclair, a young Radiophysics engineer, was strapped to the control chair in the vertex room of the telescope (the room just below the centre of the dish surface). From there, Mal was able to observe the Moon with the aid of a small telescope pointing up through the porthole-hatch near the centre of the dish surface. In case of a power failure, he was able to send commands, via the clear-call microphone, to the men hand-cranking the dish to ensure that the telescope was correctly tracking the edge of the Moon. All these extraordinary efforts meant that the dish could tip an extra 1o which was enough to guarantee that the emersion would be observed and that no radio transmissions or equipment breakdowns would interfere with, or disrupt, the observation.
The observations on 5 August were performed using dual twin-dipole feeds operating at 136 MHz and 410 MHz (each band had a single polarisation). At these frequencies the beamwidths were 118.5 and 39.3 minutes-of-arc respectively. These are larger than the diameter of the Moon. Previously, in his Jodrell Bank observations, Cyril Hazard would track the centre of the Moon in order to maintain a constant noise level (by avoiding having the Moon drift through the antenna beam). However, the Parkes telescope could not track the Moon, only the fixed celestial source. Consequently, the telescope tracked the source, 3C 273, for all the observations. At these relatively low frequencies, the Moon and sky temperature are approximately equal, so the slow drift of the Moon through the antenna beam wasn't a big problem.
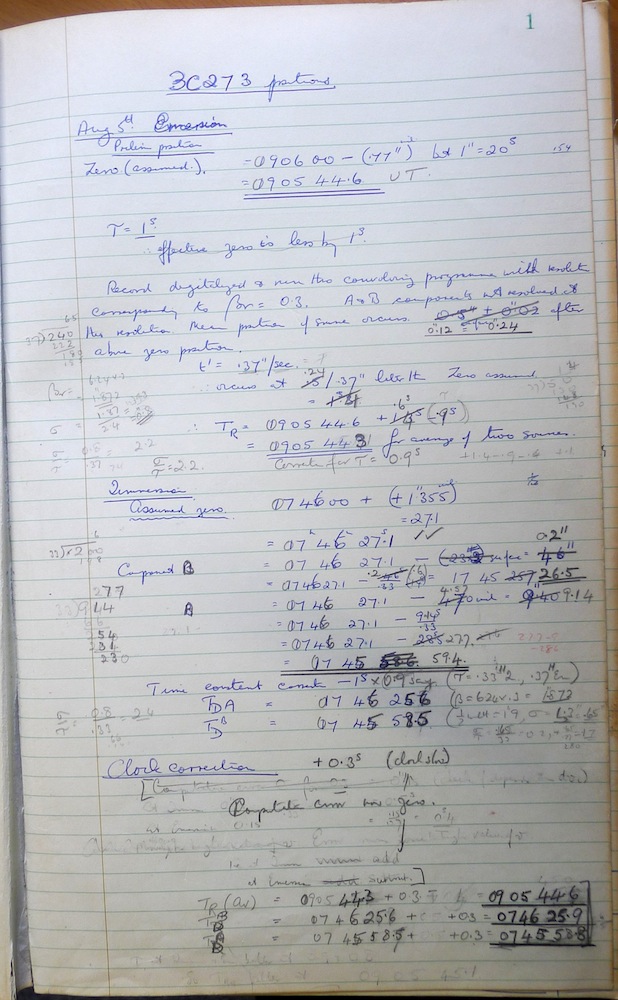
The immersion began at 5:46 PM (AEST) when the source was at an elevation of about 43.5o. About 27 seconds later a small "bump" appeared on the diffraction pattern, which indicated that the source had structure. Hazard knew from previous observations with the Nancay interferometer in France, that 3C 273 had a complex structure (it was a double source), so the observation of the "bump" didn't surprise him. At 7:05 PM (AEST) the emersion began with the source just above the telescope's 30o elevation horizon. All the effort expended to tip the dish lower proved to be unnecessary after all. For the emersion, there was no "bump" in the diffraction pattern. Hazard concluded that the position angle of the double source (the line joining the two components) was almost aligned with the edge of the Moon at emersion but was angled slightly at the immersion. Hazard was able to determine the position angle of the two components. The observations were a triumph. They allowed Hazard to calculate very accurate preliminary positions for the two components, A and B.
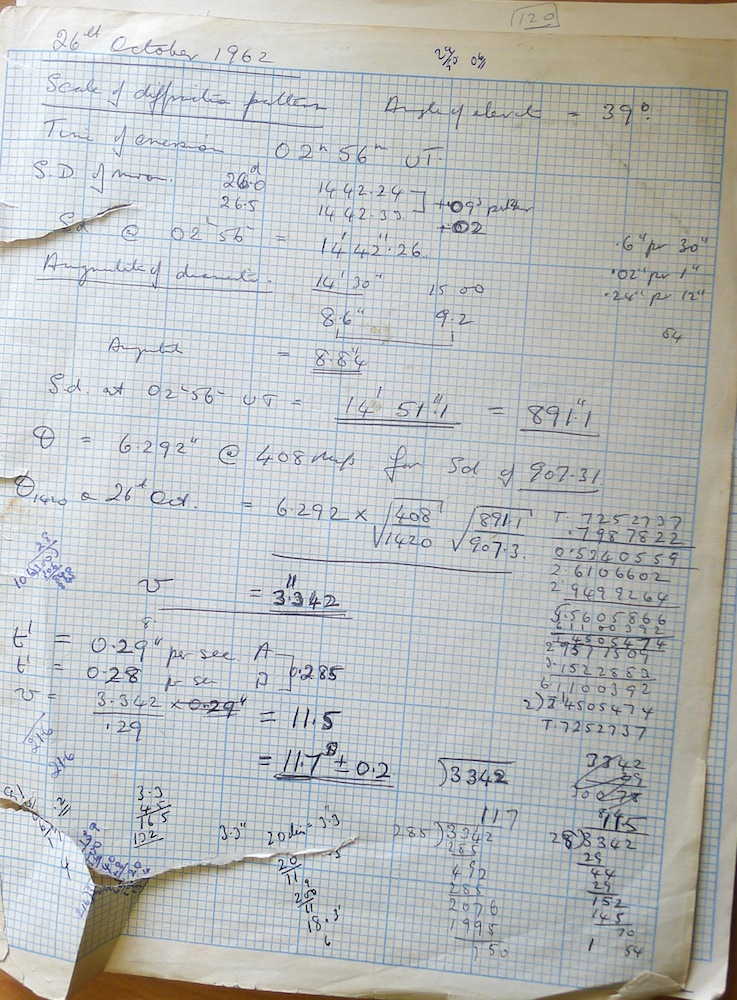
For the next observation on 26 October, only the immersion was visible. It occured at 12:56 PM (AEST) at an elevation of about 38.5o. The source set before the emersion occurred. From the 5 August observation, Hazard knew that the occultation would occur in the direction of the line joining the two components. In order to accurately determine the separation of the two components and to study the structure of Component B, observations were made at 410 MHz and 1420 MHz using a dual twin-dipole feed. At these frequencies, the antenna beamwidths would be 39.3 and 11.3 minutes-of-arc respectively. The higher 1420 MHz frequency would give greater resolution to study the structure of Component B in more detail. Sure enough, the results were phenomenal with the fringes very clearly seen in both frequencies, but especially well at 1420 MHz. The smaller beamwidth at the higher frequency, meant that the drift of the Moon through the beam was more evident with a slight gradient in the noise floor, but was negligible in effect.
An analysis of the flux densities at 410 and 1420 MHz, showed that Components A and B had spectral indices of -0.9 and 0.0 respectively. The steep spectrum of Component A showed it to be a class II radio source (a hotspot associated with a galactic jet) and contributed 90% of the total emission. However, the flat spectrum of Component B was unusual. Hazard was able to explain the 1420 MHz Component B observation by assuming that the source consists of a central bright core about 0.5 seconds-of-arc wide contributing about 80% of the total flux embedded in a halo of width of about 7 seconds-of-arc.
Using the observations of 5 August and 26 October, Hazard, with the invaluable assistance of Dr W. Nicholson of Her Majesty's Nautical Almanac Office, calculated the positions of the sources. They used Watts' charts for accurate positions of the lunar limb. These charts are the product of a 1950's photographic survey conducted by C.B. Watts (U.S. Naval Observatory) in which he measured the heights of lunar features along the edge of the Moon as recorded in thousands of photographs taken at different phases and librations. The limb profile heights are normalized with respect to an adopted smooth reference surface (or datum). Normally, a smooth spherical limb profile is acceptable for most applications. However, since some of the lunar limb topography can deviate by as much as 3 seconds-of-arc from the smooth spherical surface, the actual limb profile must be used if accuracy greater than 3 seconds-of-arc is required. The resulting laborious calculations were performed mainly by Nicholson using hand calculations and mechanical computers. The calculations were completed late in 1962. The positions obtained for the two components had an accuracy of better than 0.1 seconds-of-arc, which at that time represented the highest resolution position of any celestial object in any frequency regime, including optical. Importantly, the positions were in the optical reference frame, which allowed unique identifications of the optical counterparts to be made.
The publications in NATURE - 16 March 1963
On 16 March 1963, the papers describing the Parkes 3C 273 observations by Hazard, Mackey and Shimmins, as well as the high red-shift spectrum results by Maarten Schmidt were published in the journal, NATURE (Vol. 197). In total, four papers related to the findings on 3C 273 were published as consecutive letters. They were:
Greenstein, J.L., and Matthews, T.A. 1963. Nature 197, 1041.
Click here for a copy of the papers in NATURE (Vol. 197, 16 March 1963).
Interview with Cyril Hazard
On Monday, 11 March 2013, John Sarkissian interviewed Dr Cyril Hazard by telephone, who was at his home in the United Kingdom. In the interview Hazard recalled the 1962 Parkes lunar occultation observations of 3C 273; how they came about, the results obtained and their significance.
Cyril Hazard observing at Jodrell Bank Observatory in the 1950's. Picture supplied courtesy of Miller Goss
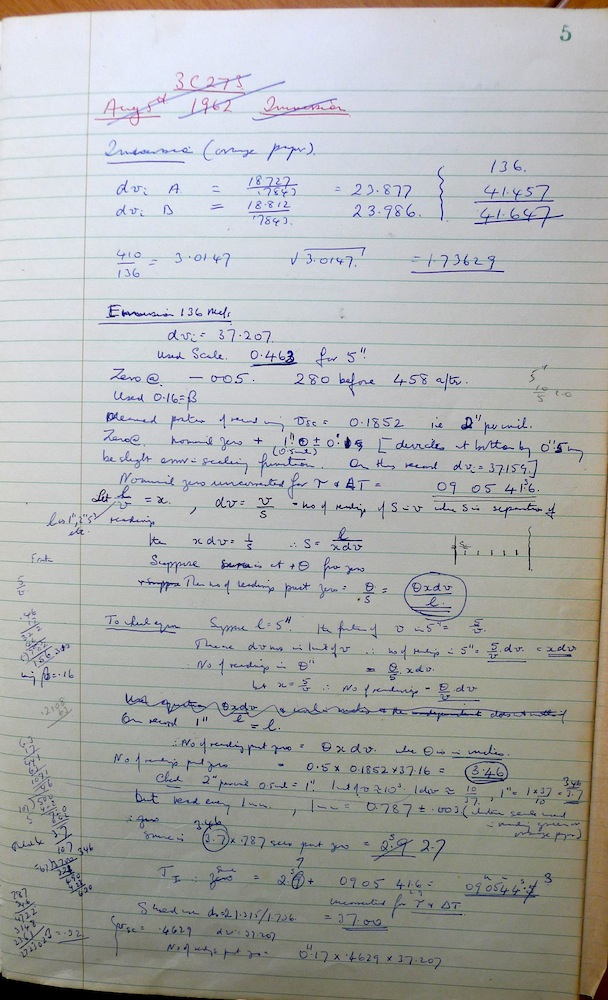
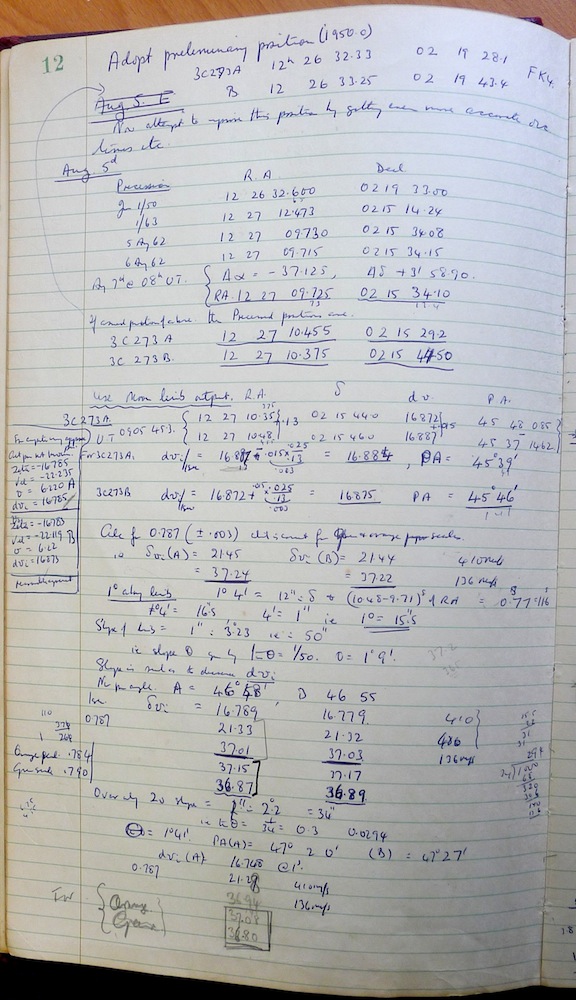
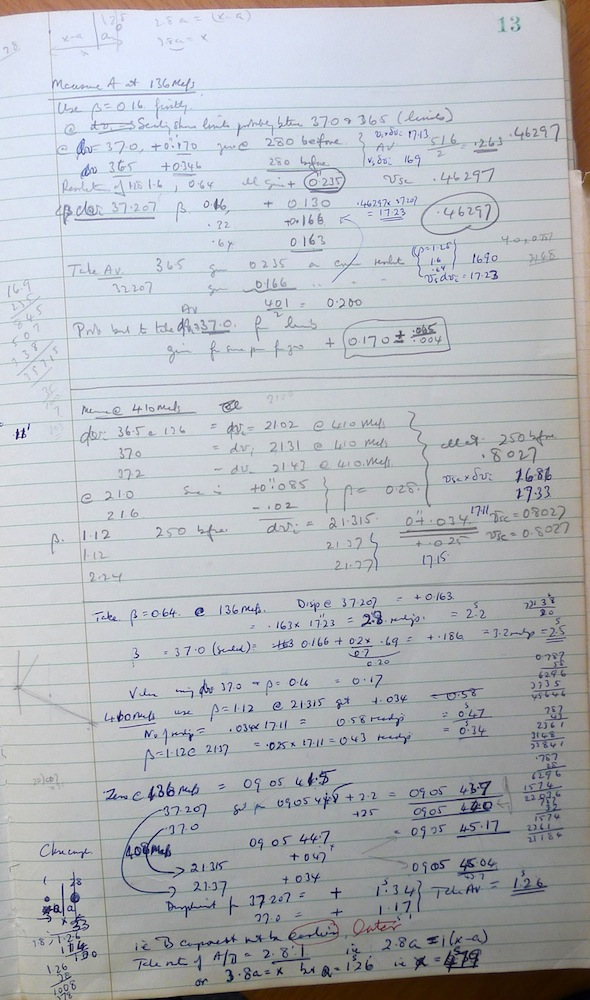
Cyril Hazard's hand-calculations of the Occultations
The lunar occultation observations were made before the wide-spread use of computers in astronomy. Consequently, Cyril Hazard calculated the timing and circumstances of the occultations by hand (and slide rule). The photographs below are of Hazard's notebooks from that period and were provided courtesy of Miller Goss.
Hazard's laborious hand calculations taken from his notebooks. (Photos provided courtesy of Miller Goss)
The Results of the Occultations
In 1962, there were a series of three lunar occultations of the strong radio source, 3C 273. The first was on 15 May 1962, when only the re-appearance (emersion) of the source from the behind the Moon was visible from Parkes. The second occurred on 5 August 1962 when both the disappearance (immersion) and re-appearance (emersion) were visible from Parkes. The final occultation occurred on 26 October 1962, when only the immersion was visible from Parkes.
Three observing frequencies were used.
15 May 1962 - 410 MHz
5 August 1962 - 136 MHz and 410 MHz
26 October 1962 - 410 MHz and 1420 MHz
For the 5 August and 26 October occultations, the telescope tracked the source, 3C 273, but for the 15 May occultation the dish was stationary at its 30o elevation limit and the Moon and 3C 273 drifted through the beam.
The following original plots are in the possession of Cyril Hazard and were provided courtesy of Miller Goss.
15 May 1962
5 August 1962
26 October 1962
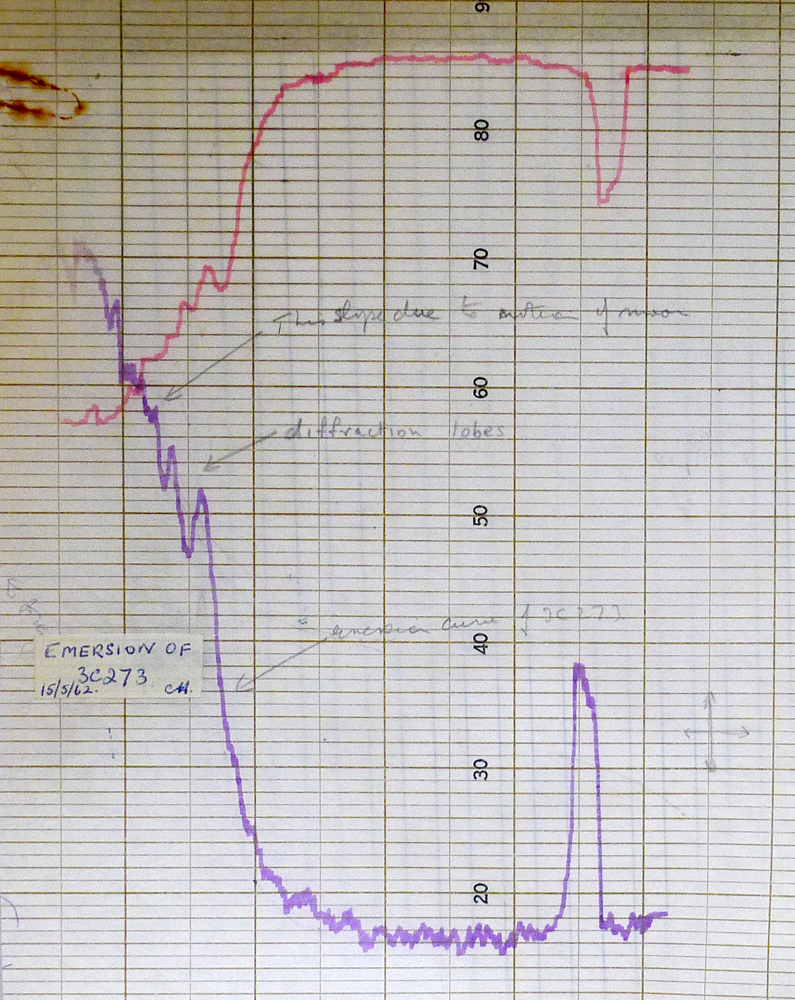
The 410 MHz occultation plot of the emersion of 15 May 1962. Note the gradient of the noise floor as the Moon (and the source) drifted through the beam of the telescope as it was stationary at the 30o horizon limit.
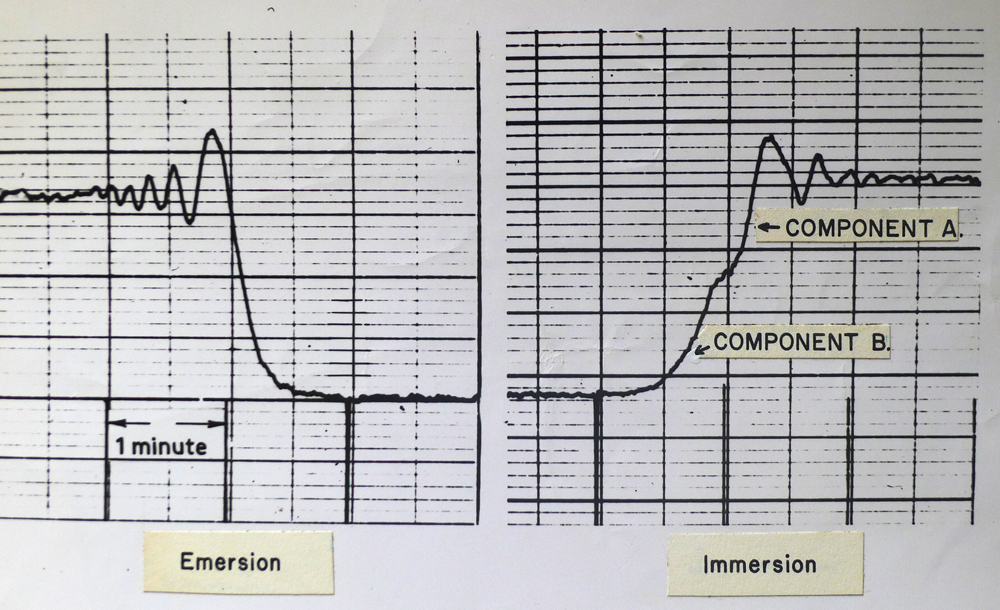
The 410 MHz occultation plots of the immersion and emersion of 5 August 1962. There was another 136 MHz observation not shown here. Note the bump of "Component B" in the immersion plot indicating that there was structure in the source.
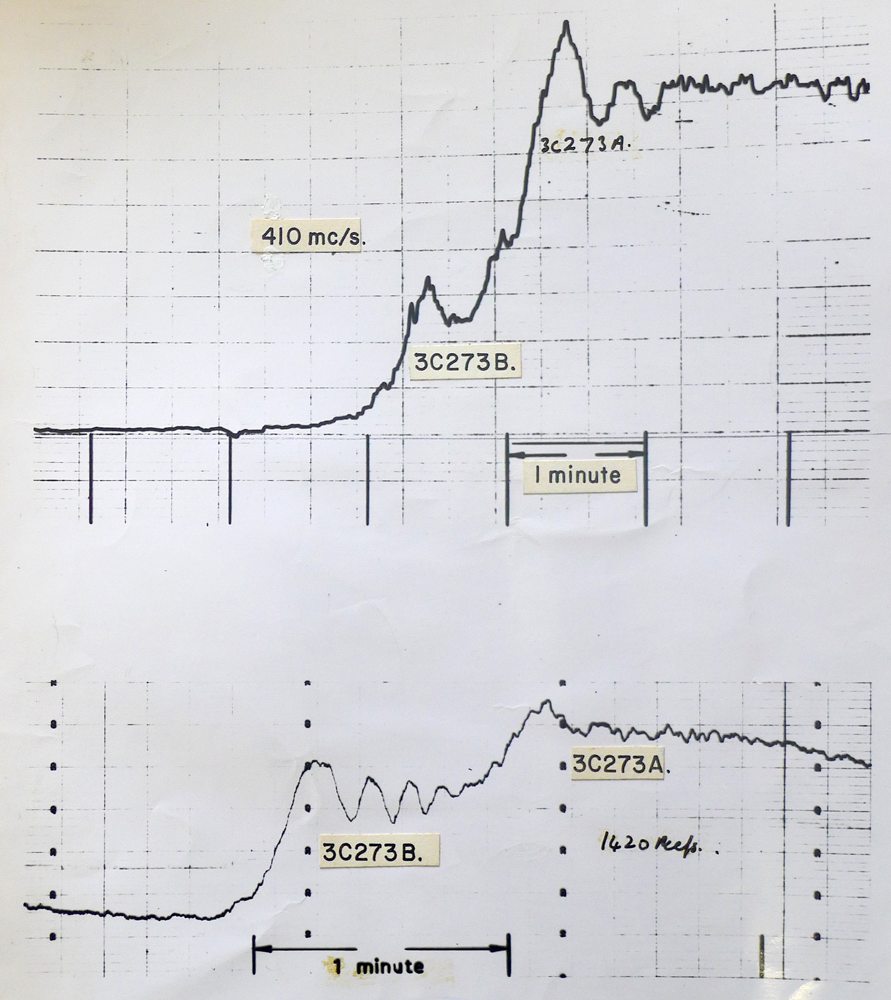
The two plots of the immersion at 410 MHz and 1420 MHz on 26 October 1962. The direction of the occultation was along the line joining Components A and B, resulting in a high resolution Fresnel diffraction pattern of Component B (the quasar).
Summary of the results of the 1962 occultations
Date
Event
Source
Time (UT)
5 Aug 1962
Immersion
A
07:46:00.0
B
07:46:27.2
Emersion
A
09:05:45.5
B
09:05:45.7
26 Oct 1962
Immersion
A
02:55:09.0
B
02:56:01.5
Calculating the Positions
Schematic representation of the geometry of an occultation.
Each occultation time defines a position of the Moon's limb as viewed from the appropriate observatory and the determination of the source position therefore involves the calculation of these limb positions. The calculations require an accurate lunar ephemeris, parallax corrections for the location of the observatory relative to the centre of the Earth, and corrections for the deviation of the apparent limb of the Moon from a smooth sphere centred on the ephemeris position.
In the schematic diagram above, the circles represent the outlines of the Moon at the times of immersion (TI) and emersion (TE). The two times define two positions of the centre of the Moon. The points of intersection of these two cricles give two possible positions of the source, P1 and P2, one on either side of the Moon's path and perpendicular to its direction of motion. The ambiguity in position can be resolved by observing a second occultation of the source but in many cases this may not be necessary. The position may have already been measured with sufficient accuracy by other methods to decide between the two positions or it may be possible to measure it using the antenna system in the conventional manner. If the source position is at P1, the occultation curves at immersion and emersion correspond to the strip brightness distributions along TIP1 and TEP1, respectively.
The position of the source can be further refined by observing multiple occultations. After calculating the position of the mean limb at each of the occultation times, corrections are applied to allow for the deviations of the true limb from the idealised profile. Corrections are applied using lunar limb profile data such as Watts' charts. The positions of the corrected limbs define lines along which the source must lie. These lines are tangent to the lunar limb. The position of the source is the point that represents the minimum perpendicular distance to all the lines.
In the case for the 1962 occultation observations, three times were obtained; the immersion and emersion times for 5 August and the immersion time for 26 October. Using Watts' charts for the position of the corrected lunar limb, Hazard was able to determine the lines along which each component must lie. These three lines produced a triangular arrangement. The component position was the point that represented the minimum perpendicular distance from these lines.
Hazard's determination of the component positions from the three occultation times. Note how on 5 August, the line joining components A and B is nearly parallel with the lunar limb correction lines. Consequently, the two components were occulted almost simultaneously. The immersion line is slightly angled, giving rise to the little "bump" of component B. On 26 October, the correction lines are nearly perpendicular to the line joining the two components. This allowed the two components to be resolved separately, resulting in high resolution fringes for both.
Component
RA (B1950)
Dec (B1950)
A
12h 26m 32.38s
+2o 19' 27.8"
B
12h 26m 33.29s
+2o 19' 42.0"
For a full description of the method of lunar occultation measurements, see "Lunar Occultation Measurements" by Cyril Hazard, "Methods of Experimental Physics" Volume 12 - Part C, Chapter 4.6.
The Circumstances of the Occultations
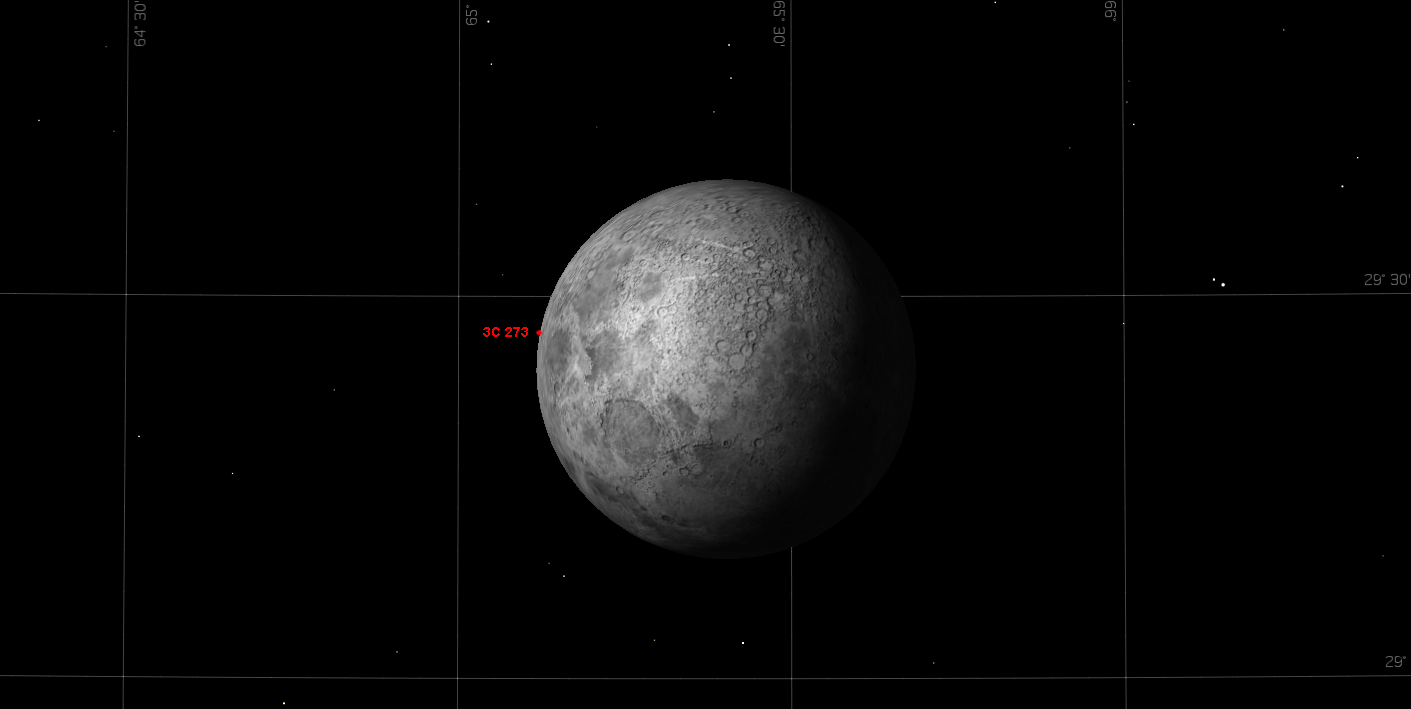
Below are images showing the circumstances of the occultations as seen from Parkes (produced using "Starry Night"). Click on the images to see the larger versions. In the animated sequences, 3C 273 is shown with its alternative designation of HIP60936 (from the Hipparchos Catalogue). The speed of the animations is 300x normal.
15 May 1962 - Emersion at 5:35 PM (AEST)
The observation occurred just below the telescope's 30o elevation limit as the source was rising. The source, 3C 273, was emerging from behind the Moon. The dish was stationary at this point and the two drifted through its beam.
Animation of the occultation - 15 May 1962 from 17:30 - 18:03 (AEST)
Animation of the occultation with daylight removed for clarity
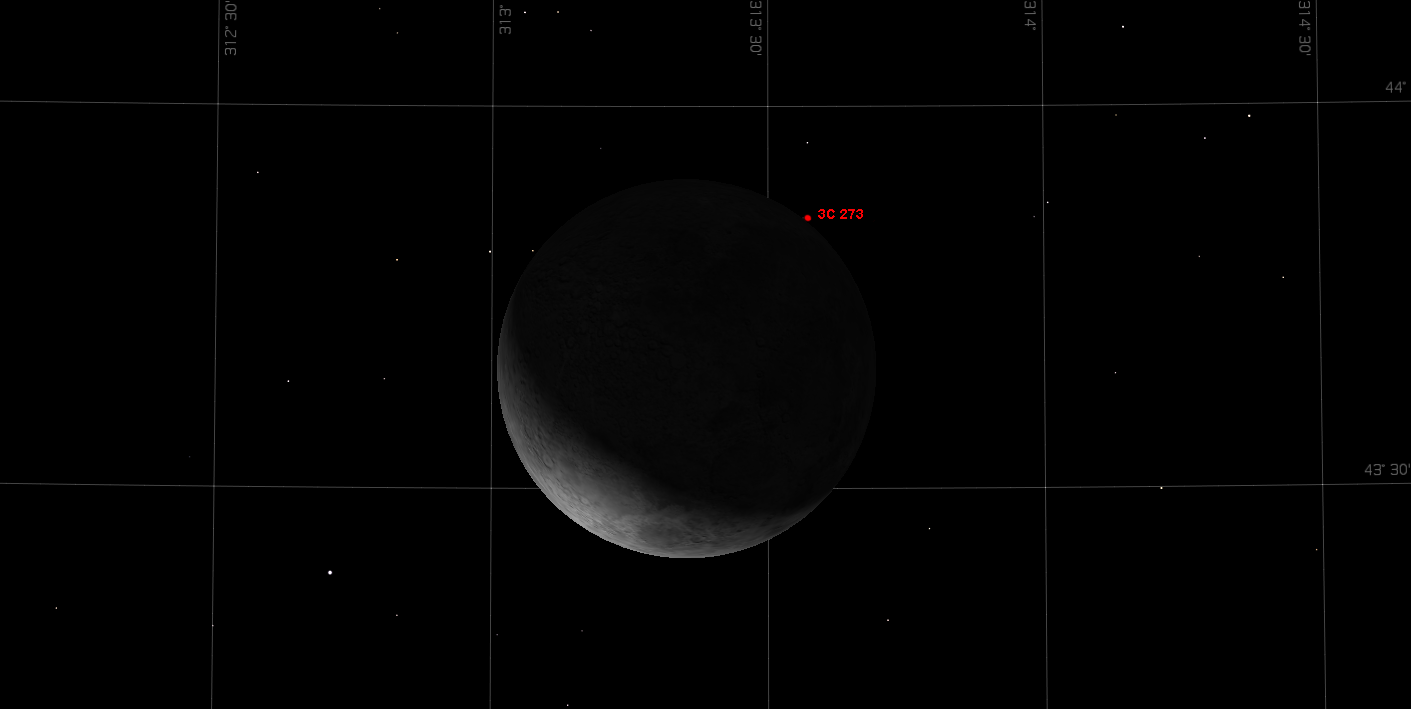
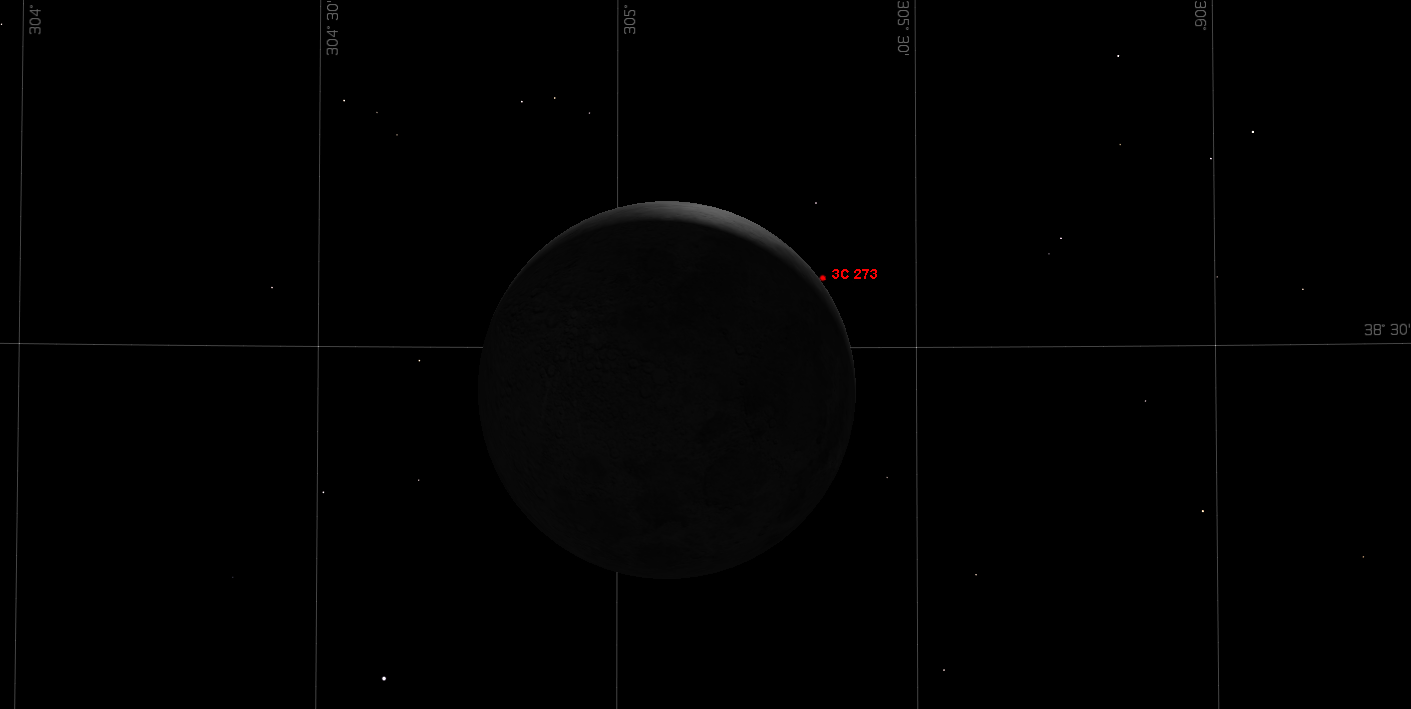
5 August 1962 - Immersion at 5:46 PM (AEST) and Emersion at 7:06 PM (AEST)
The source 3C 273 disappeared behind the Moon at 5:46 PM (AEST).
The source 3C 273 re-emerged from behind the Moon at 7:06 PM (AEST) just before it set below the telescope's 30o elevation horizon.
Animation of the occultation - 5 August 1962 from 17:30 - 19:11 (AEST)
Animation of the occultation with daylight removed for clarity
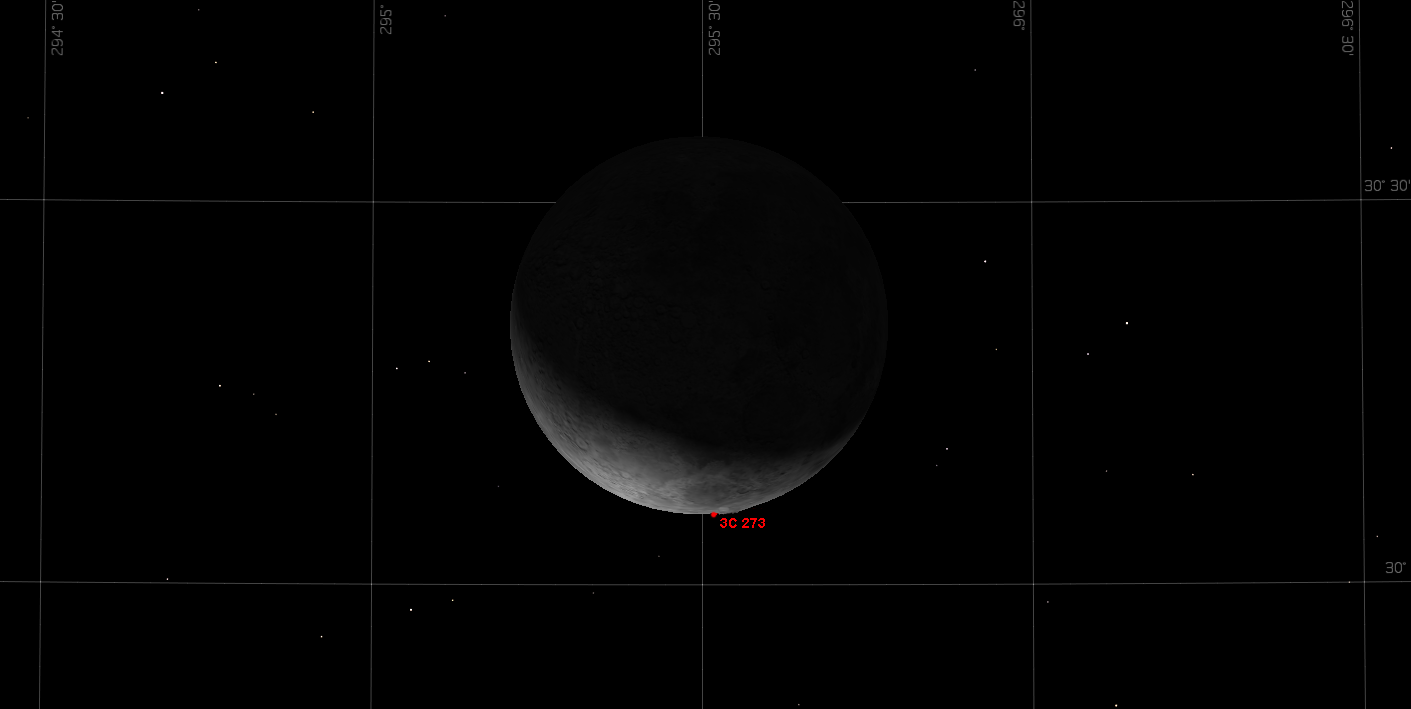
26 October 1962 - Immersion at 12:56 PM (AEST)
The source 3C 273 disappeared behind the Moon at 12:56 PM (AEST).
Animation of the occultation - 26 October 1962 from 12:34 - 13:45 (AEST)
Animation of the occultation with daylight removed for clarity
Adjustments to the Telescope
Marcus Price, John Bolton's PhD student at Parkes in 1962, recalls the adjustments to the telescope made by John Bolton to get the telescope to tip as far as possible and ensure the occultations were observable from Parkes:
By this time the Australians believed very firmly in the anti-serendipity effect. When they did 3C273 ..... they weren't going to count on any help at all from serendipity. We had multiple recorders set up. We even had staff ready with cranks to turn the great gears to make the telescope go around should there be a power failure - until somebody remembered that if there were a power failure the receiver wouldn't work either! We jimmied all the stops and safety cutoffs so that we could drive the dish clear to the ground. But as we got close to the ground in a test run, we discovered that there was a ladder that extended down from the bottom of the telescope that went below the lip of the dish. John Bolton adjusted things again with his hacksaw. So, they were really ready to do this with no help from serendipity.
The First Years at Parkes, by R.M. Price, "Serendipitous Discoveries in Radio Astronomy", Proceedings of a workshop at the NRAO, 4-5 May 1983, edited by Kellerman and Sheets.
Early photograph showing the ladder extending below the dish.
The dish fully tipped over showing how close the ladder got to the ground.
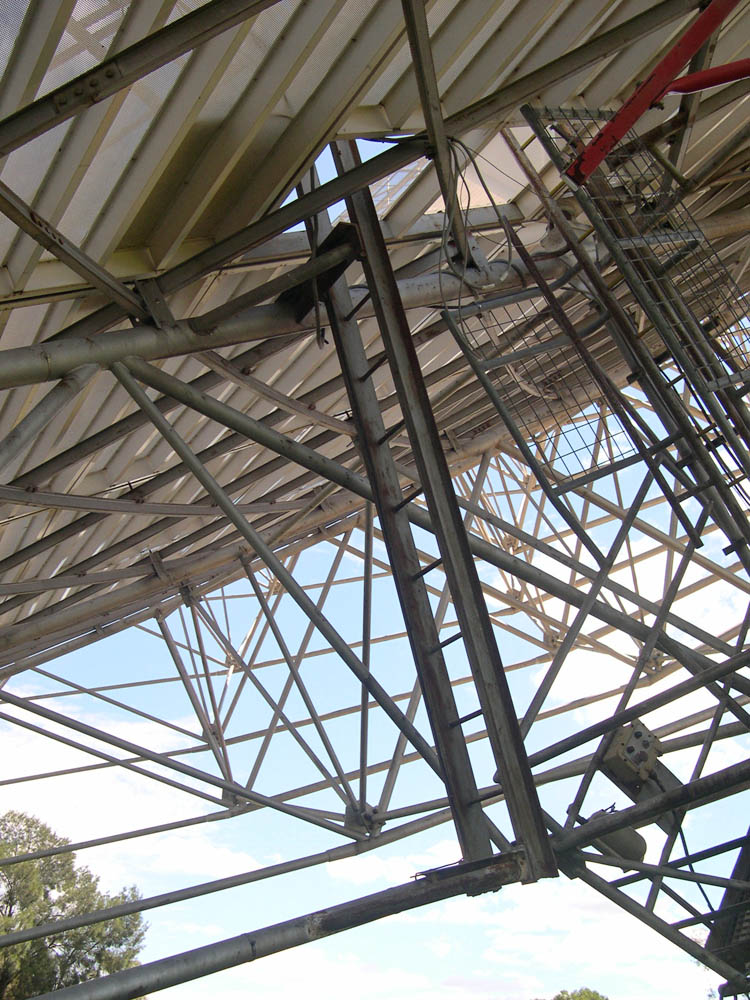
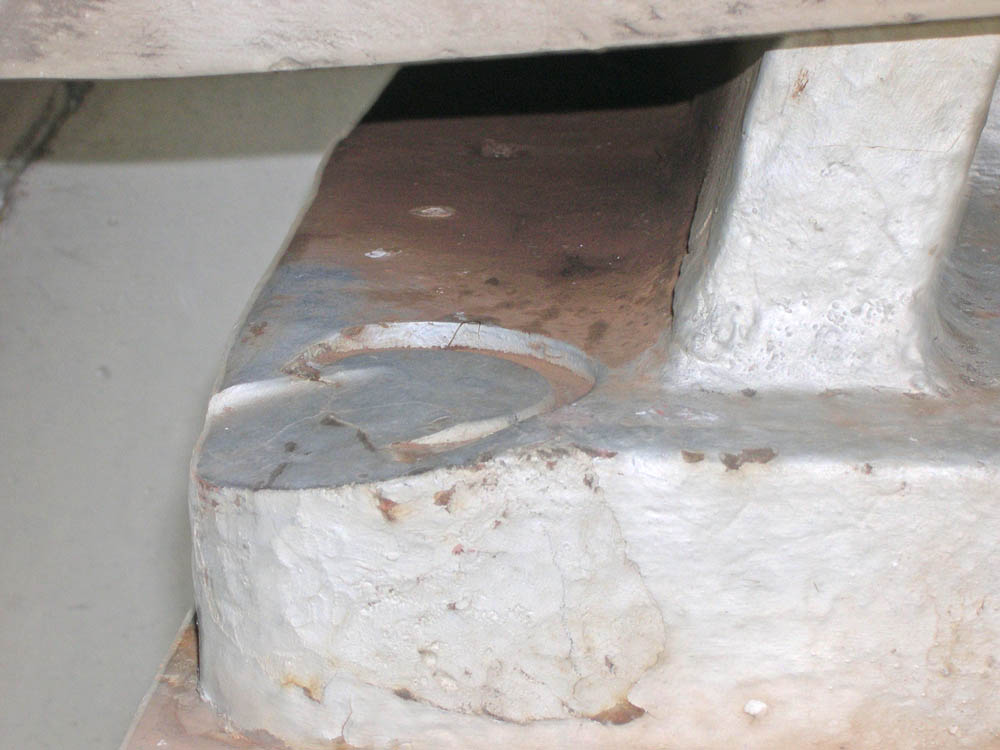
March 2013 photograph showing the ladder cutoff at the base.
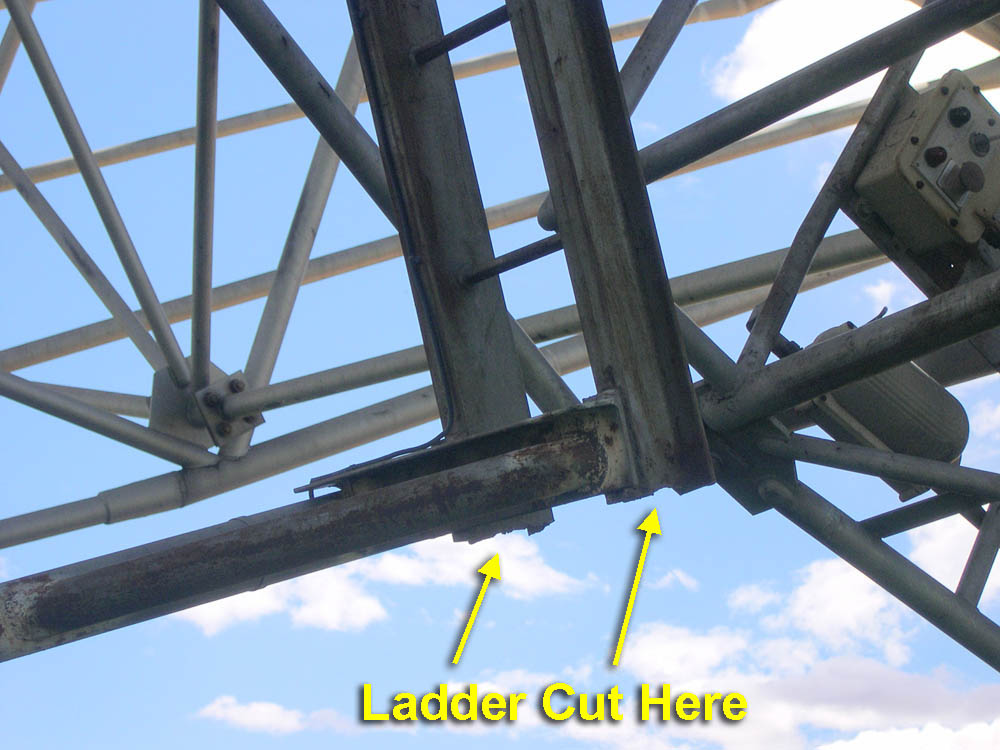
Closeup of the ladder cutoff at the base.
John Shimmins recalled the preparations:
It seemed likely that at emersion, as 3C 273 reappeared from behind the Moon, the zenith angle of the telescope would be slightly greater than 60o. The telescope will only go to 60o and then there is a solid stop. When you reach it bells ring and the brakes are applied. So, we simply removed the safety stops from operation for that observation. Just to be certain, John Bolton took a grinder and cut away some of the housings of the zenith angle bearings. This meant that we could tip the dish by almost another degree. During the occultation the rim of the dish was practically touching the ground.
"Beyond Southern Stars: Radio Astronomy and the Parkes Radio Telescope" by Peter Robertson.
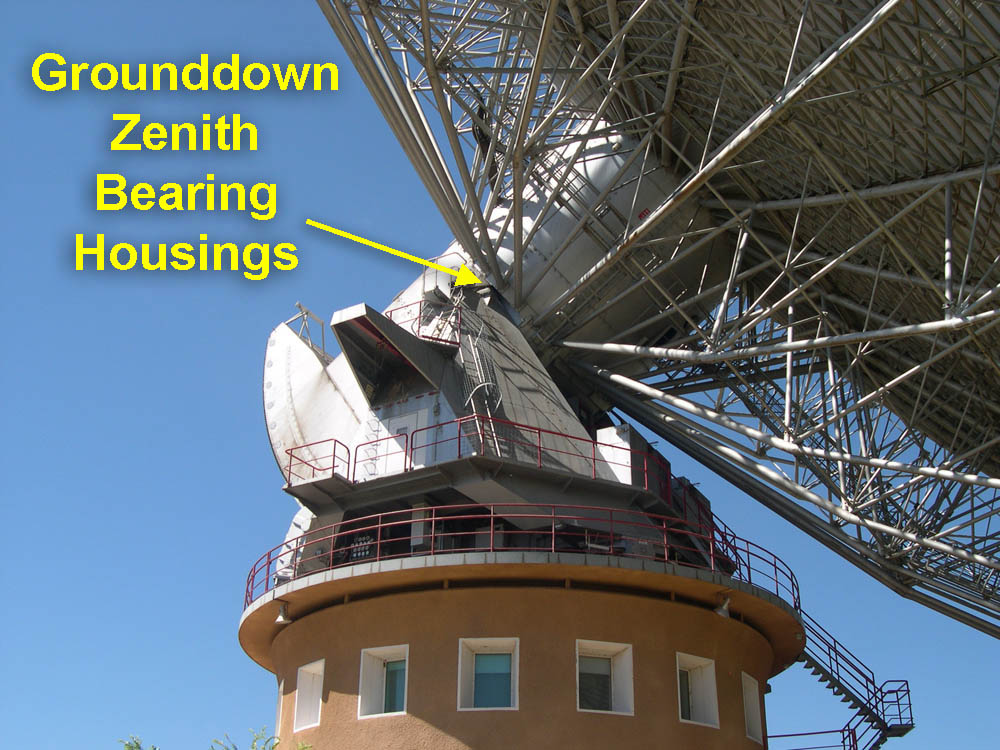
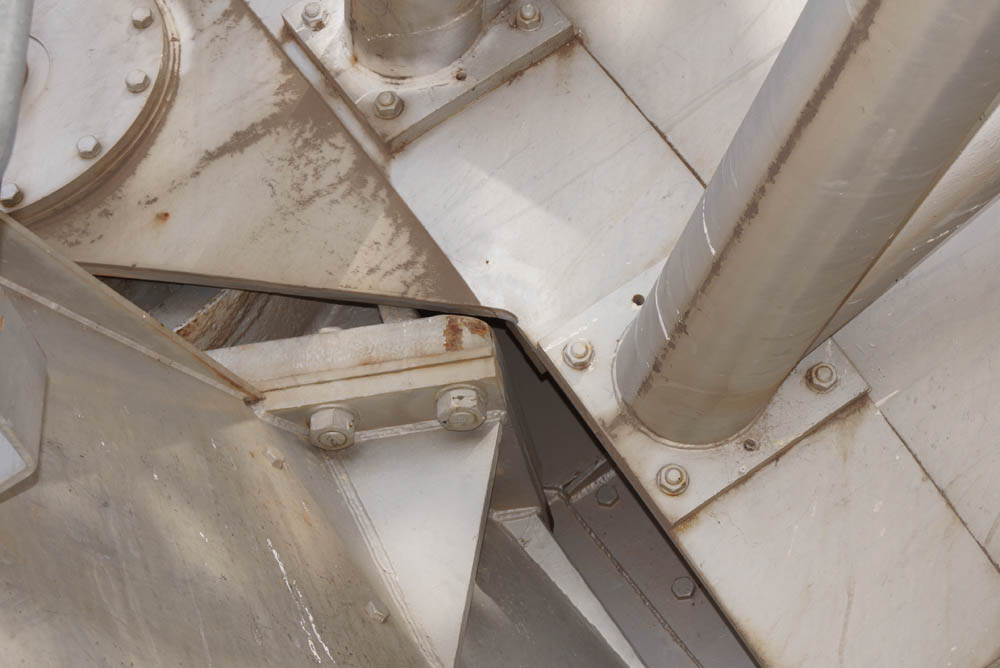
The location of the right-hand side zenith angle bearing housing. The left-hand side was ground down also.
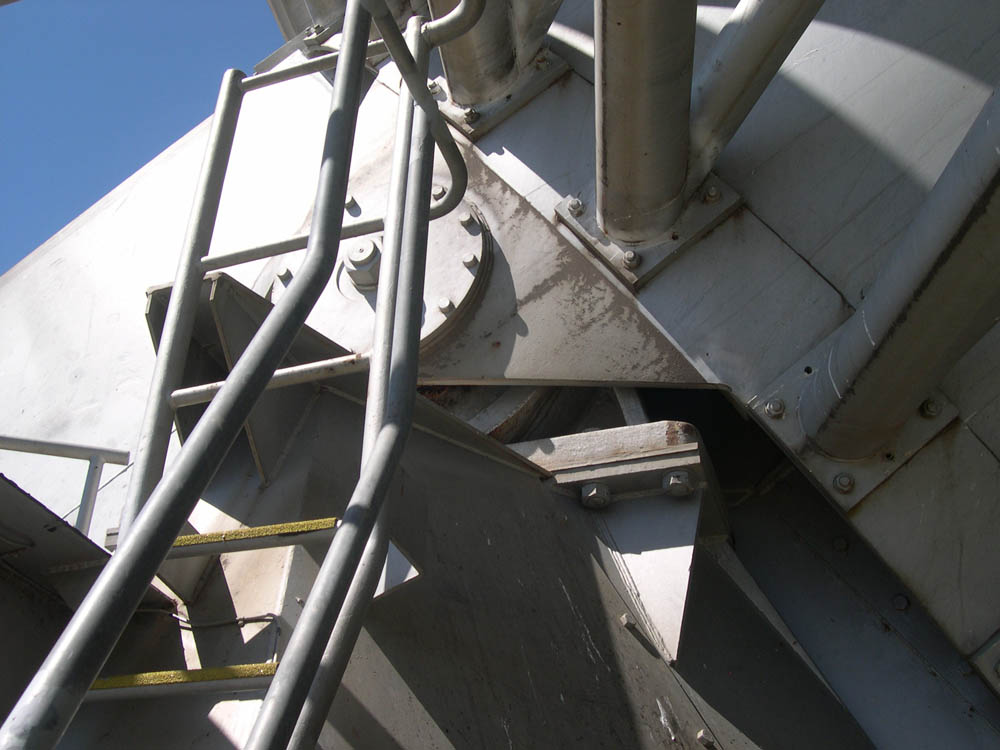
The housing was ground down to allow the dish to tip below the 60o zenith angle limit.
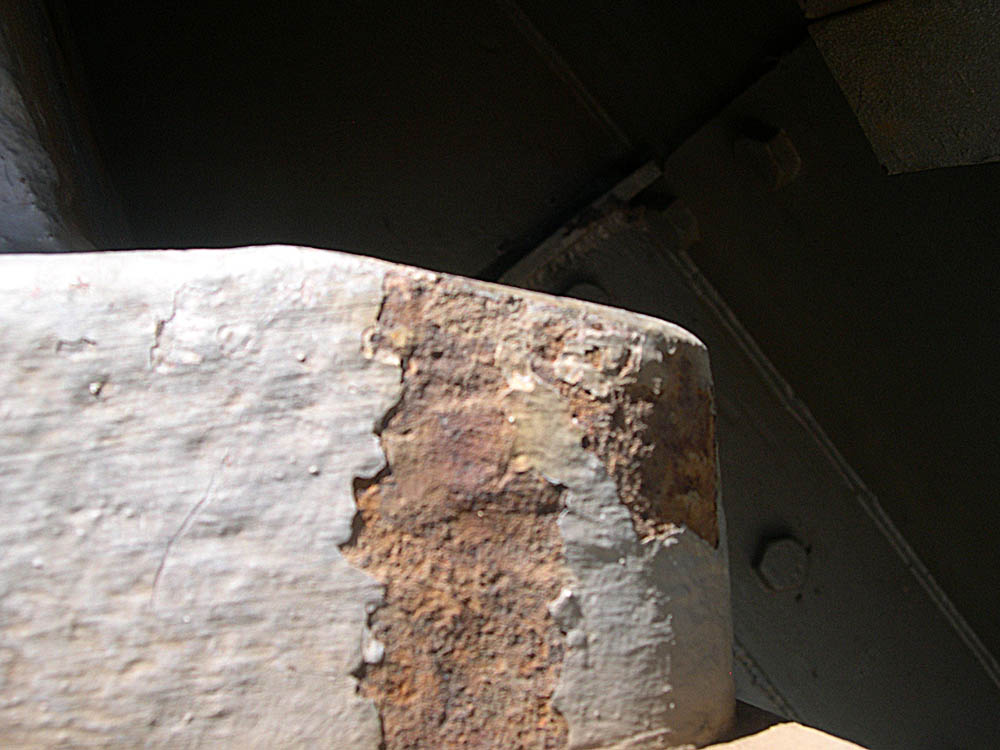
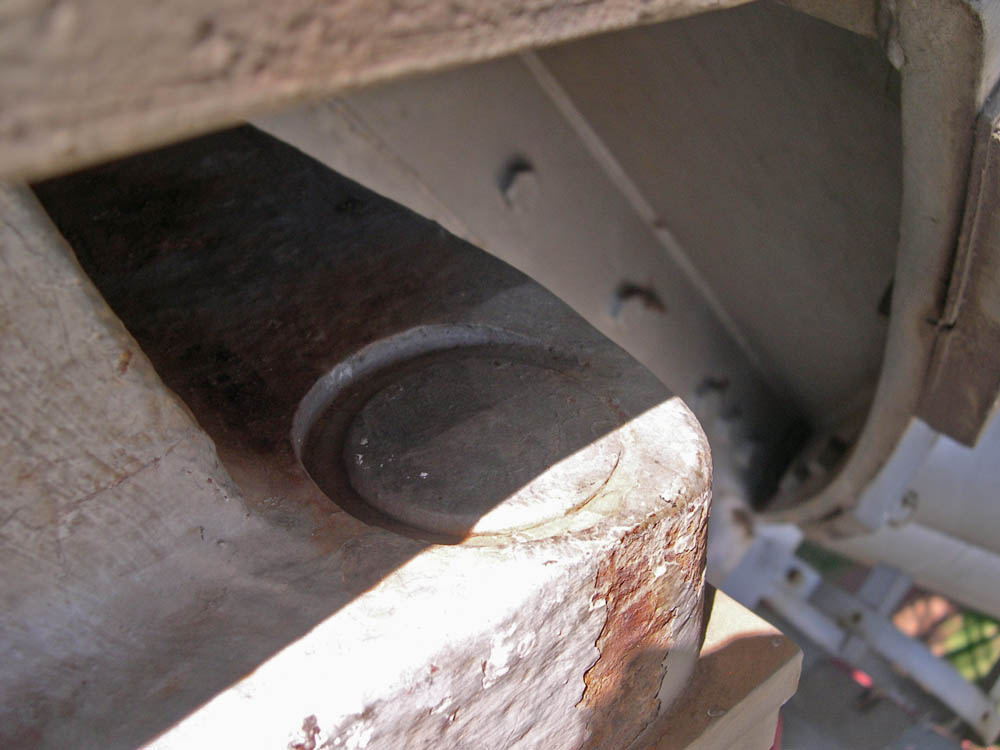
Closeup of the housing ground to an angle at the end.
John Bolton ground the ends of the zenith angle bearing housings to allow the dish to tip beyond the 60o zenith axis limit.
Both sides were ground down. This is a view of the left-hand side.
The ground down ends allowed the dish to tip so far that the rim was almost touching the ground.
The Dual Band Receivers at Parkes
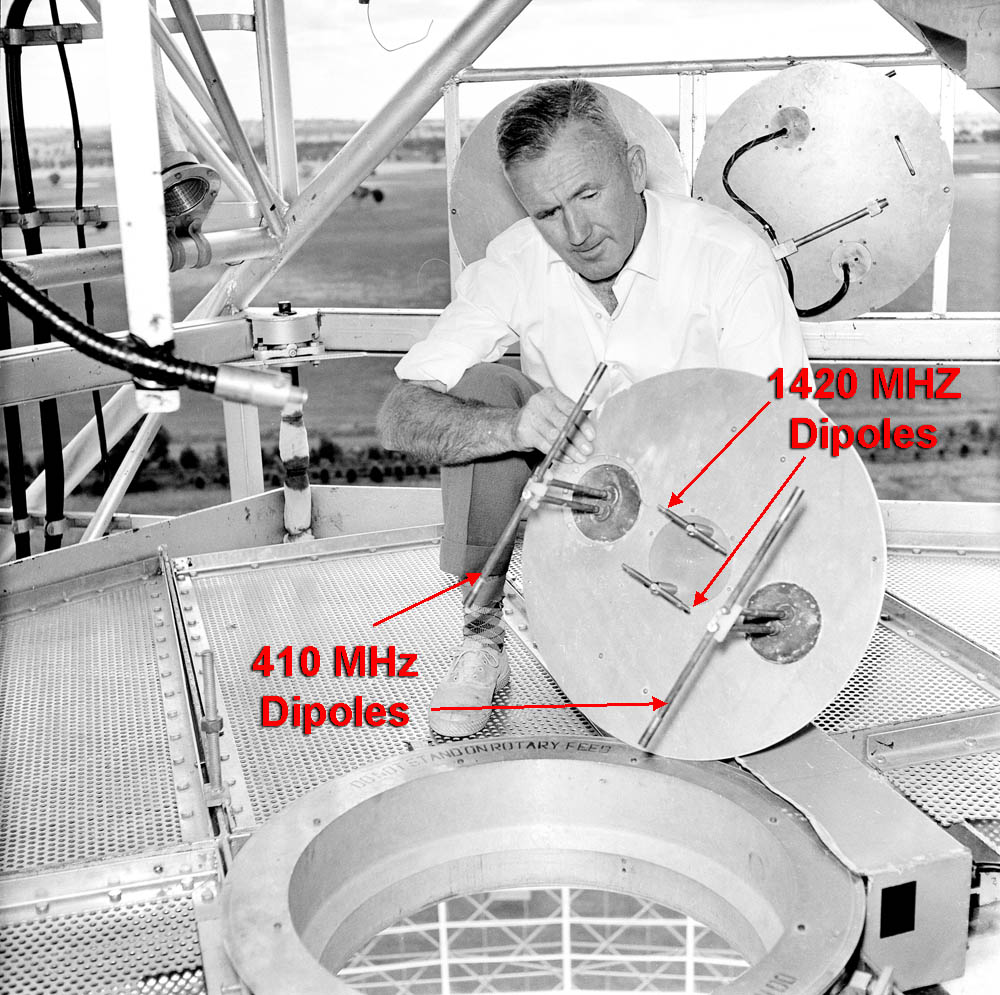
Each of the observations at Parkes were made at two frequencies using dual-frequency co-axial feeds ("co-axial" meaning the two frequency bands share the boresight axis, rather than one being offset). One set of observations was performed at 136 MHz and 410 MHz, and another set at 410 MHz and 1420 MHz. These feeds were simple twin-dipole feeds. Each of the twin dipoles was arranged normal to the other. Since only one polarisation was possible in each band at any one time, in order to obtain the full linear polarisation in each band, the feeds would be rotated 90o and a new measurement made. The two observations would then be combined to give the full polarisation in each band. For the 3C 273 observations, there was insufficient time to rotate the feeds during an occultation event, so the observations were performed at one polarisation only in each band.
Frank Tonkin is shown installing the 410 MHz and 1420 MHz dual band feed on the feed rotator in the focus cabin of the Parkes Telescope.
The larger dipoles appear to be about 36cm long (wavelength/2 ie. 73cm/2 for 410 MHz) and the smaller dipoles about 10cm (21cm/2 for 1420 MHz). This particular feed was used for the occultation of 26 October 1962.
Re-reduction of the Data - Hazard 1971 and Herald 2011
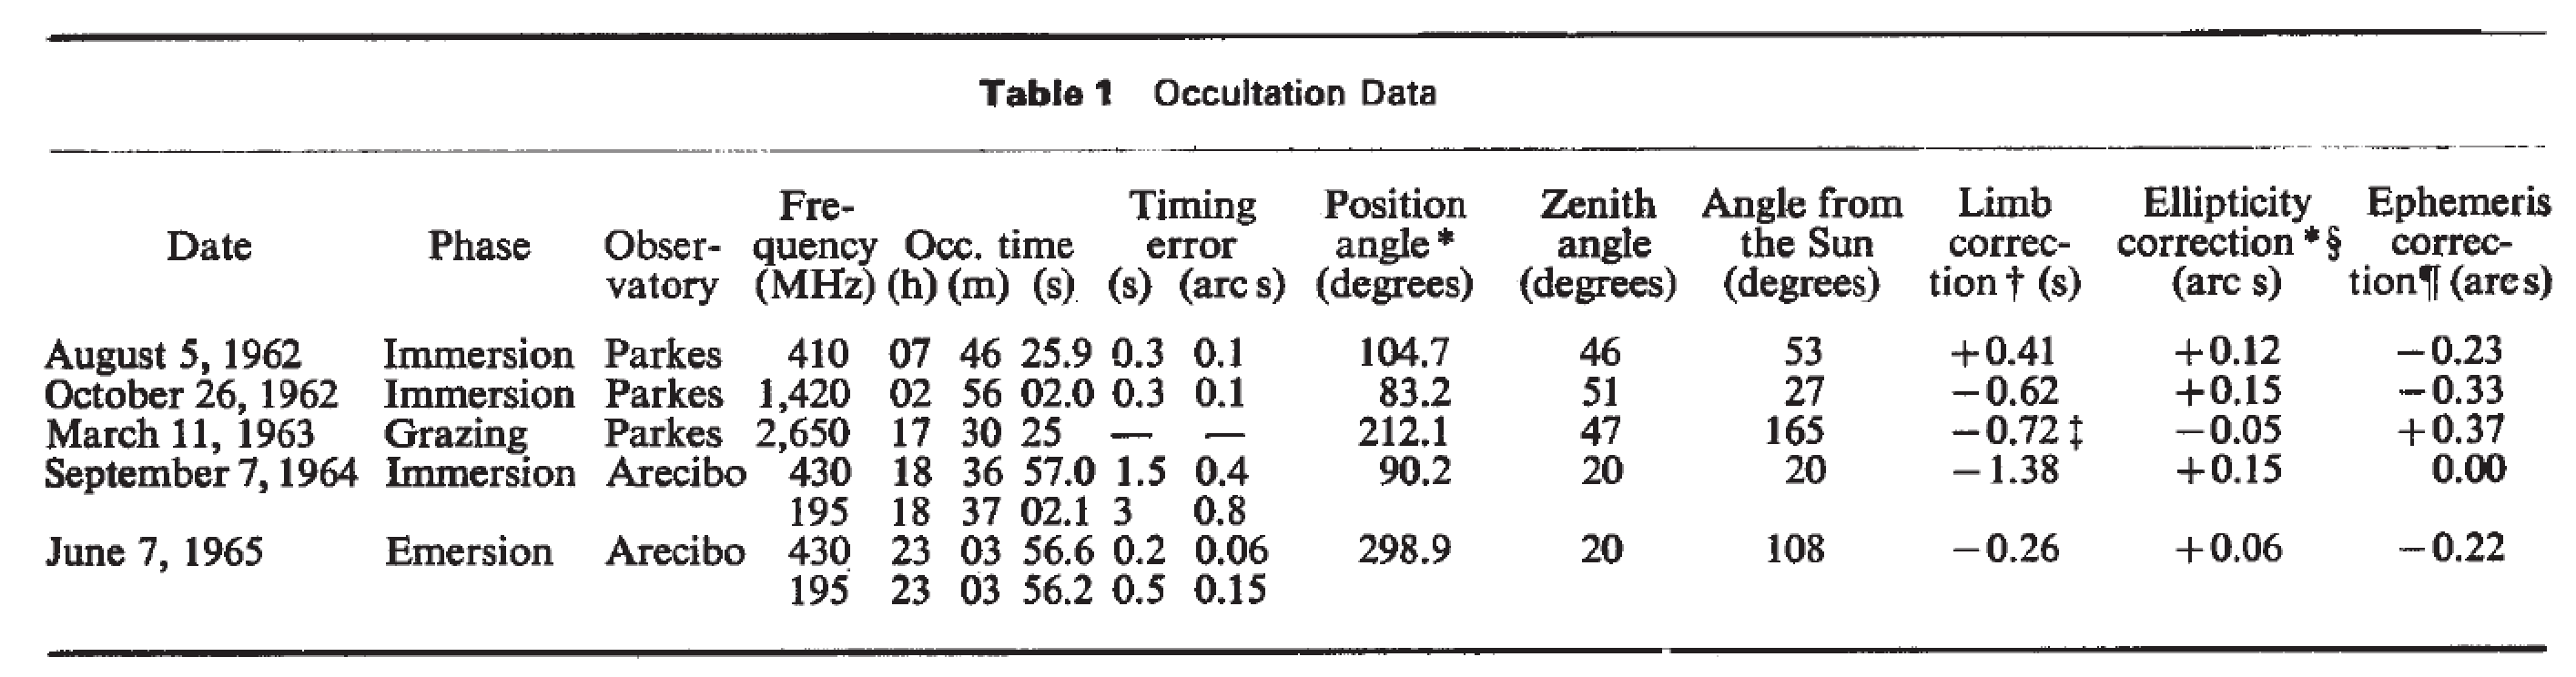
On 11 March 1963, a grazing occultation of 3C 273 was observed from Parkes. In late 1963, Hazard moved to Cornell University where he continued his lunar occultation observations using the giant dish of the Arecibo Observatory. Two occultations of 3C 273 were observed from Arecibo on 7 September 1964 and 7 June 1965. See "A High-Resolution Study of the Radio Source 3C273" by Hazard et al. NATURE Vol. 210, 28 May 1966.
In 1971, Hazard et al used the new digitised version of Watts' charts, to refine the position of 3C273B. They compared the results with various optical and radio position determinations. See "Accurate Radio and Optical Positions of 3C273B" by Hazard et al, Nature Physical Science. Vol. 233, 4 October 1971.
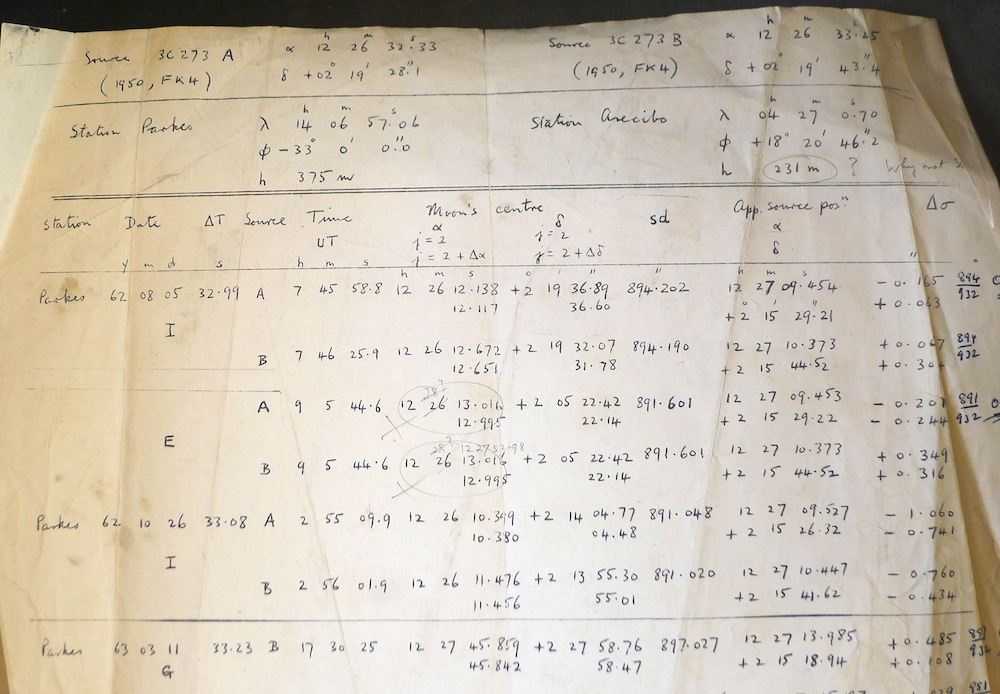
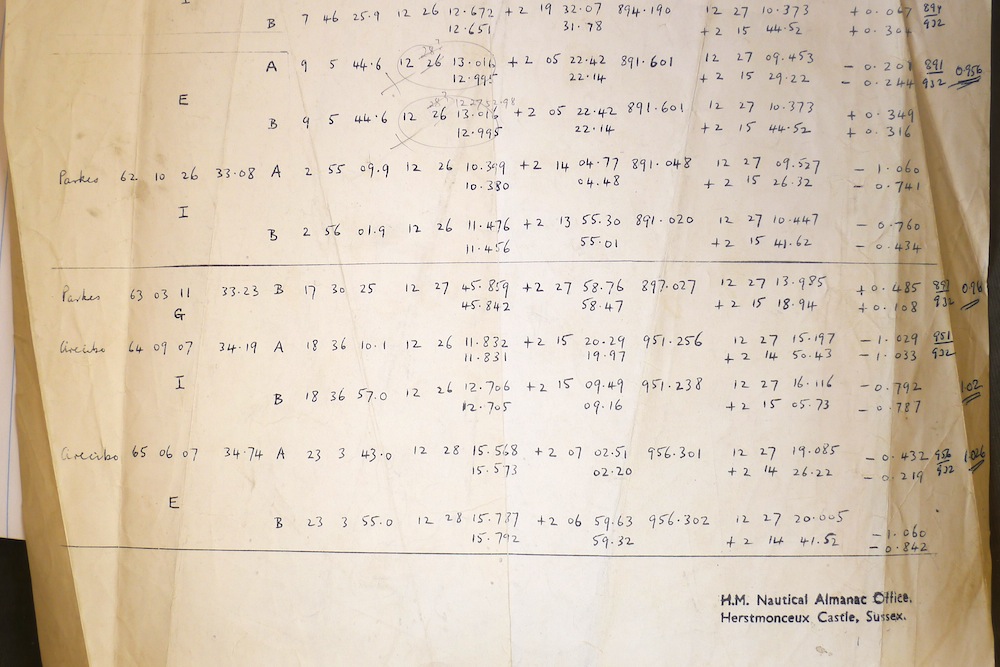
The observations used by Hazard et al to refine the position of 3C273B.
The re-reduction of the 3C 273 occultation data by Hazard et al in 1971. (Provided courtesy of Miller Goss)
Corrected lunar limb positions (B1950) defining lines along which the source 3C273B must lie. The cross in the centre denotes the re-calculated position of component B. (The position for 7 September has been discarded in deriving the final radio position). The separate optical determinations are denoted by C and RGO. M and vH, the radio positions of Moffer and van Hoerner; J, the position given by von Hoerner based on data from Jeffreys.
In 2011, Australian amateur astronomer, David Herald, re-reduced Cyril Hazard's 3C 273 observations by using improved lunar ephemerides and the new lunar limb profile data from the Japanese Kaguya lunar mission. The Kaguya data is a factor of 10 improvement over the old Watts tables used by Hazard in the 1960's and 1970's. David Herald explains:
I re-reduced the observations from Parkes and Arecibo using;
the JPL-DE423 lunar ephemeris
the VLBA J2000 coordinates of 3C 273 with the lunar limb profile being derived using the Kaguya data from the Selene mission.
Of the seven observations involved:
One Parkes event was a "grazing" occultation with poor precision. This was disregarded (but is shown in the plot as a dashed line)
Two Arecibo observations were of the same event, but had a time difference of 5 seconds. The later time was disregarded.
The two other Arecibo observations were of the same event, but had a time difference of 0.4 seconds, and were both included.
This resulted in 4 measures of separation between the lunar limb and the VLBA position. The plot with the various lines on it is a representation of the location of the lunar limb at the time of the occultation - with the origin being at the VLBA position of 3C 273.
To derive the position of 3C 273 from the lunar occultation, one simply has to find the location that represents the minimum distance to all of the lines. The location is:
dRA = -0.06"
dDec = +0.15"
On the plot, I have indicated that location (with the size of the marker indicating the uncertainties). Note that in the plot, Declination increases to the top, and RA increases to the left. The end result is the position derived from the lunar occultation referenced to the origin of the plot.
The re-reduction of the Hazard data by David Herald in 2011.
Comparison positions of Component B
Result
RA (B1950)
Dec (B1950)
Hazard 1962
12h 26m 33.29s
+2o 19' 42.0"
Hazard 1971
12h 26m 33.253s
+2o 19' 43.47"
Herald 2011
12h 26m 33.242s
+2o 19' 43.46"
VLBA
12h 26m 33.2458s
+2o 19' 43.306"
Maarten Schmidt obtains a spectrum with a high red-shift
In December 1962, the accurate position of 3C 273 obtained by Hazard from the Parkes lunar occultation observations, was passed on to Tom Matthews of Caltech's Owens Valley Radio Observatory. Matthews then showed it to another Caltech astronomer, Maarten Schmidt. Upon the recent retirement of Rudolph Minkowski, Schmidt had taken over his project of obtaining spectra of objects which had been found to be radio emitters. Using the 200-inch Mount Palomar telescope, Schmidt obtained a spectrum of the source which indicated that 3C 273 had a red-shift of 16%. If this red-shift was cosmological in origin, that is, if it obeyed Hubble's Law, then it implied that 3C 273 was an enormous distance away (billions of light years). This had immense consequences for our understanding of the Universe.
The spectrum used by Maarten Schmidt to determine the redshift of 3C 273.
In a paper published in the proceedings of a workshop held at NRAO, West Virginia, from 4-6 May 1983, "Serendipitous Discoveries in Radio Astronomy", Maarten Schmidt described how he determined the high red-shift of 3C 273. Click here for a PDF copy of the paper. In 1975, Maarten Schmidt also provided an oral history of his discovery for the American Institute of Physics. A transcript can be found here. The relevant section is here.
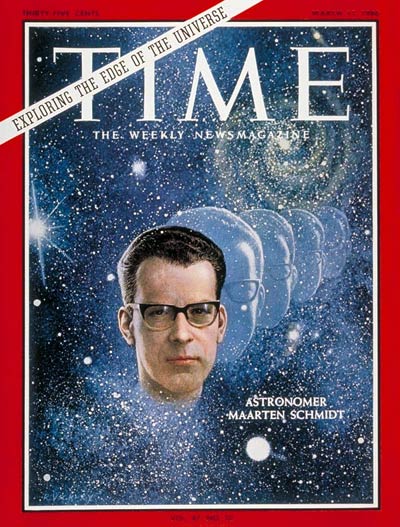
As a result of this work, Maarten Schmidt appeared on the cover of Time magazine on 11 March 1966.
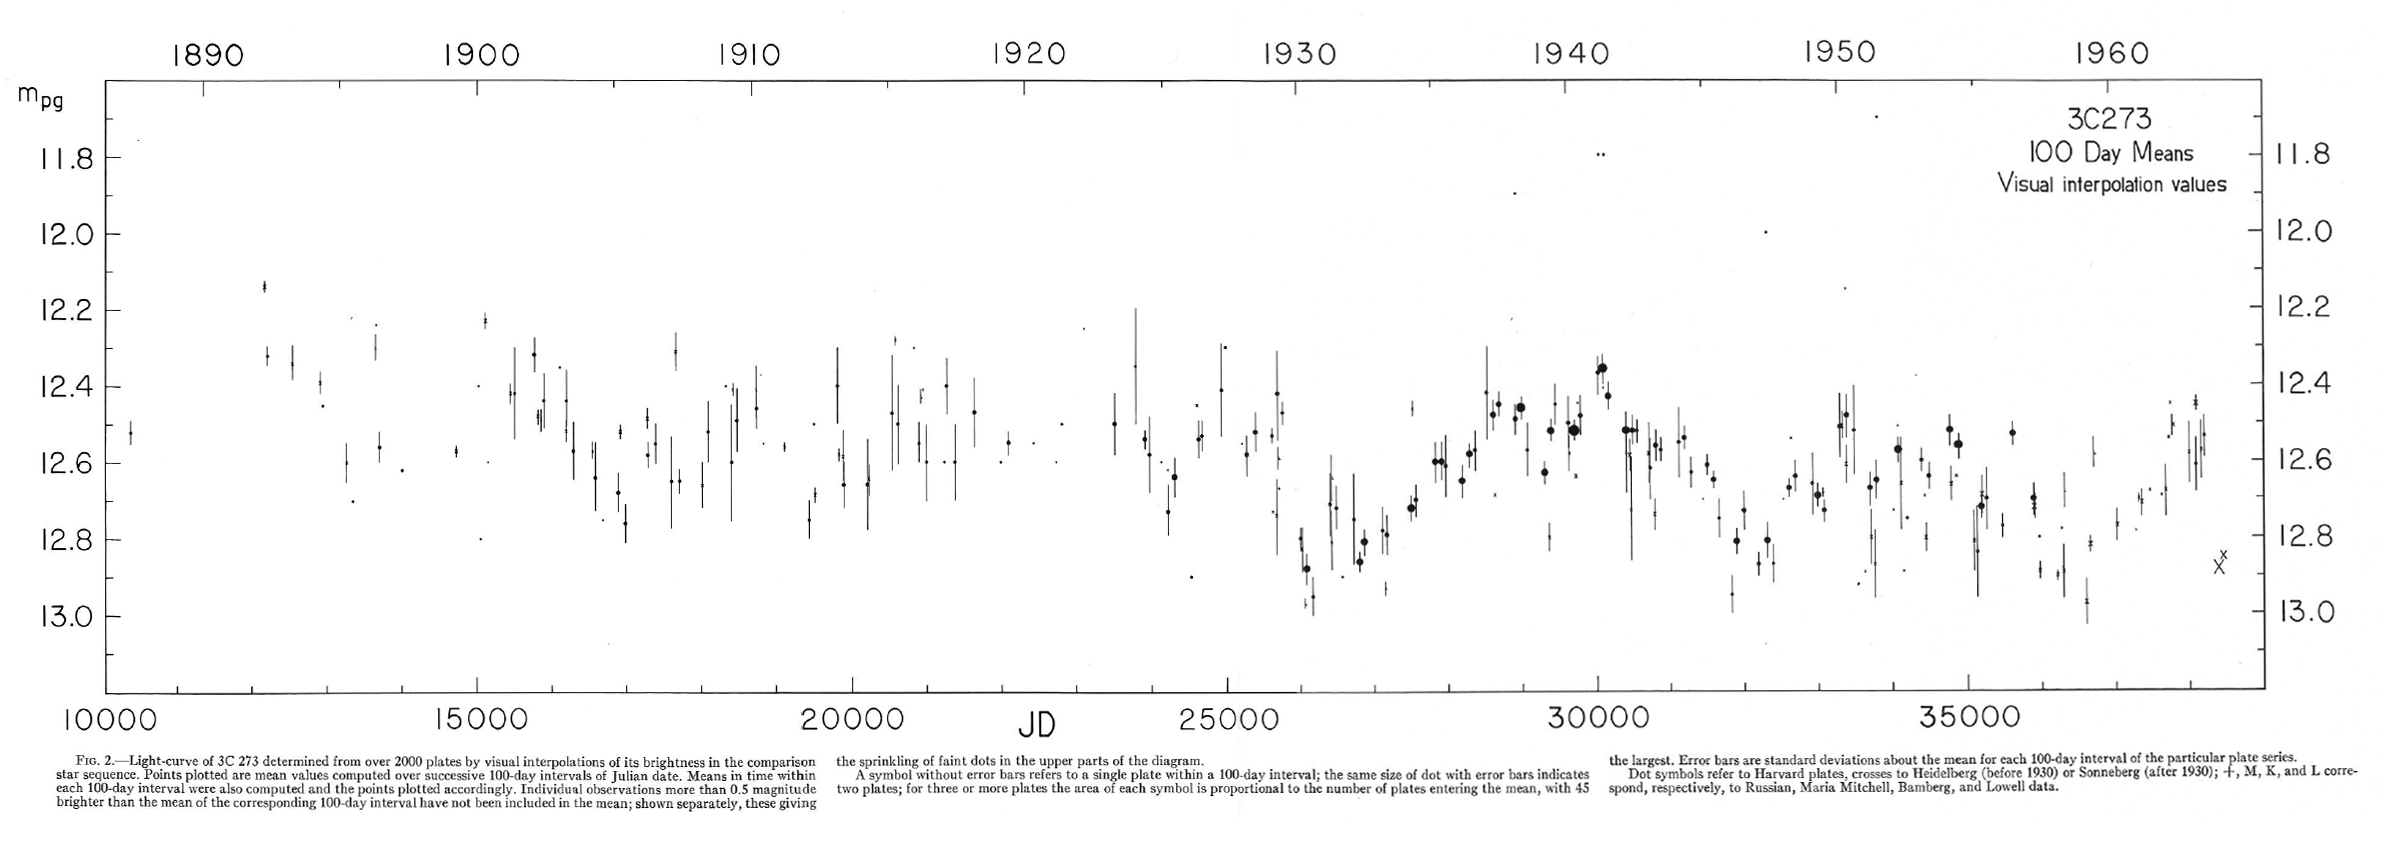
The Variability of 3C 273
Click here to see the light curve of the light variations of 3C273
(From chapter 16, "Light Variations of 3C 273" by Harlan J. Smith, Proceedings of the First Texas Symposium on Relativistic Astrophysics")
The First Texas Symposium on Relativistic Astrophysics - 16-18 December 1963
Click here to download the "Sky and Telescope" article on the First Texas Symposium held on 16-18 December 1963 (13 MB PDF file). Scan provided courtesy of Anthony Trelford
Maarten Schmidt Visits Parkes in March 1963
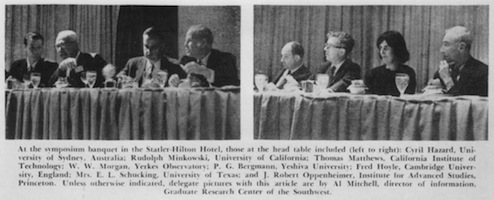
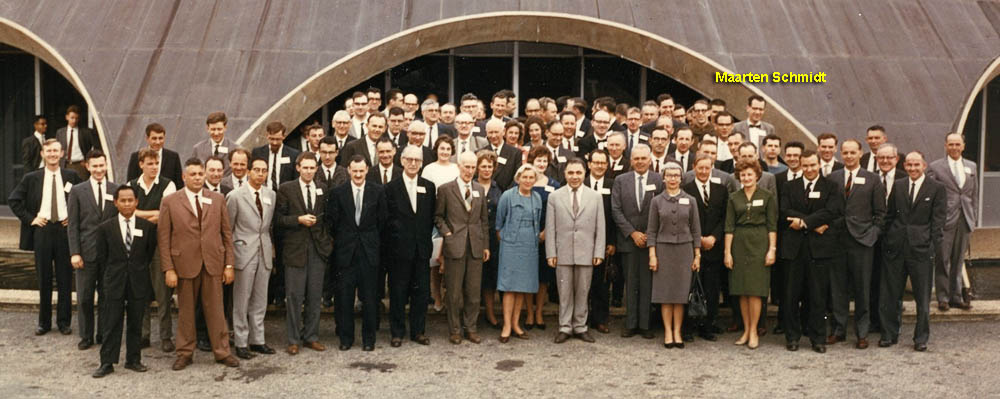
On 14 March 1963, Maarten Schmidt visited Parkes Observatory just days before the publication of the NATURE papers. He was in Australia to attend the IAU-URSI Symposium No. 20 "The Galaxy and the Magellanic Clouds", held in Canberra from 18-28 March 1963. The great Soviet Armenian astronomer, and IAU President, Prof. Victor Hampartsumian, was present as well as a host of emminent astronomers including Jan Oort and Bart Bok. On 22 March, they led a group on a tour to Parkes Observatory. They were greeted by John Bolton, the Director of the Parkes Observatory, and Edward "Taffy" Bowen, the Chief of the CSIRO's Radiophysics Division. The 3C 273 identification was not on the conference agenda, but there is little doubt that it was discussed by the conference participants. One of the ANU students tasked with looking after the delegates was a young Ron Ekers, the future Director of the CSIRO's ATNF (1988-2003) and IAU President (2003-2006).
The group photograph of the conference participants taken in front of the conference venue at the Australian Academy of Sciences building in Canberra. In the front is IAU President, Victor Hampartsumian, with Maarten Schmidt as indicated.
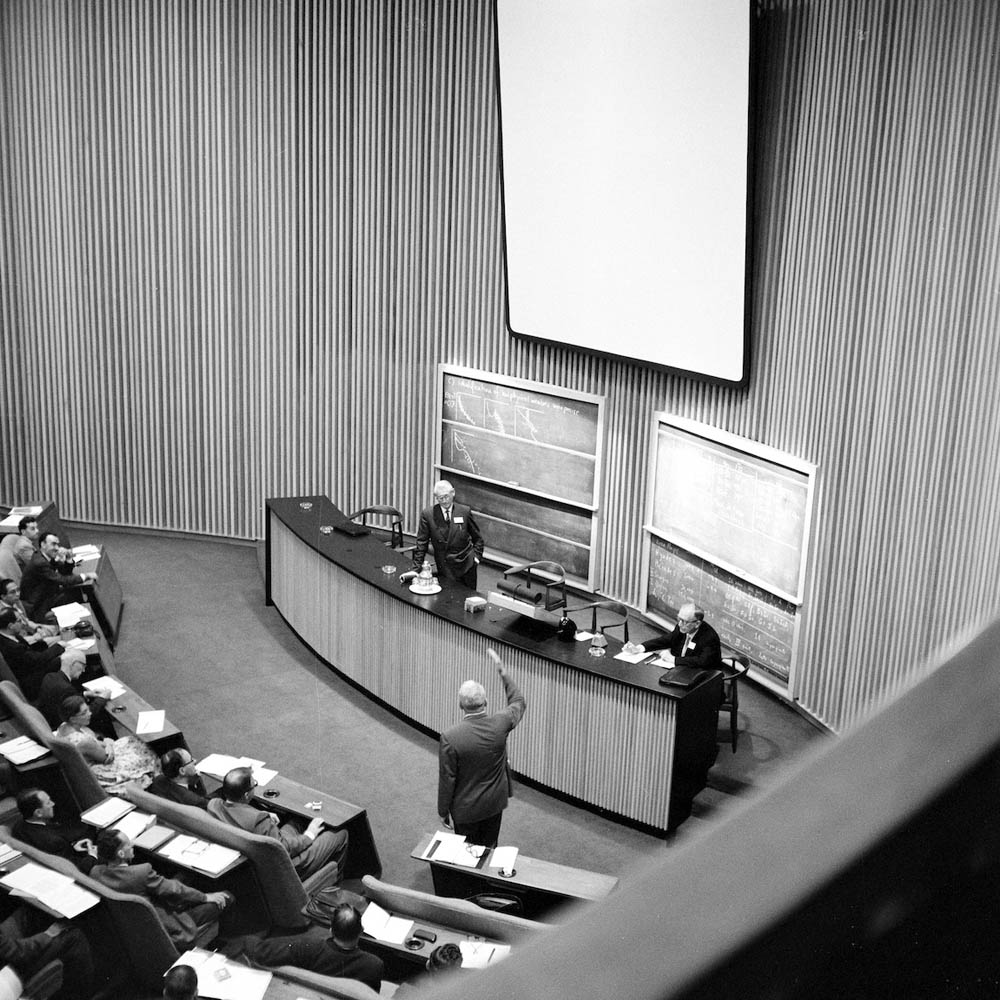
The conference in progress in the Academy of Sciences building.
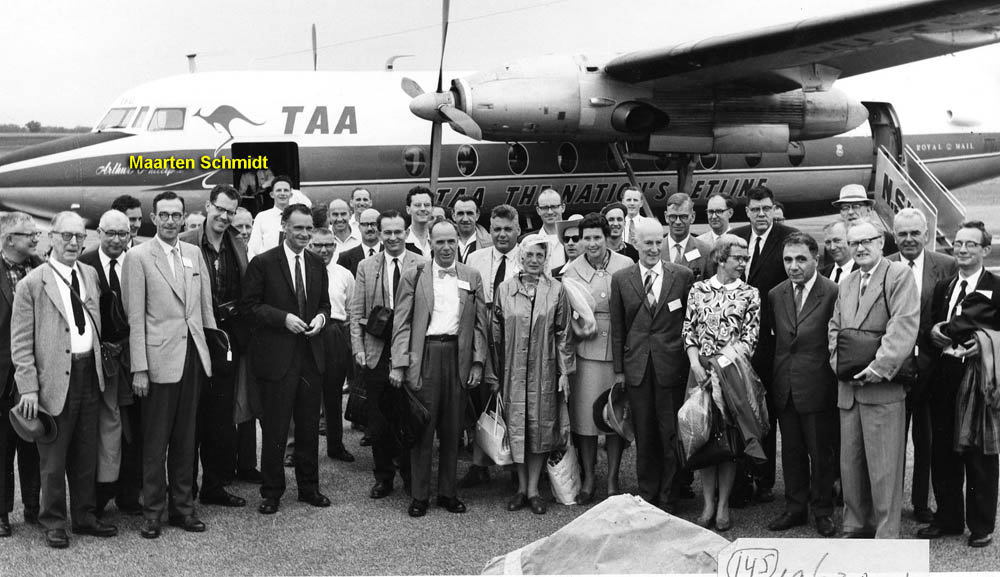
The conference delegates being greeted at Parkes airport by Taffy Bowen.
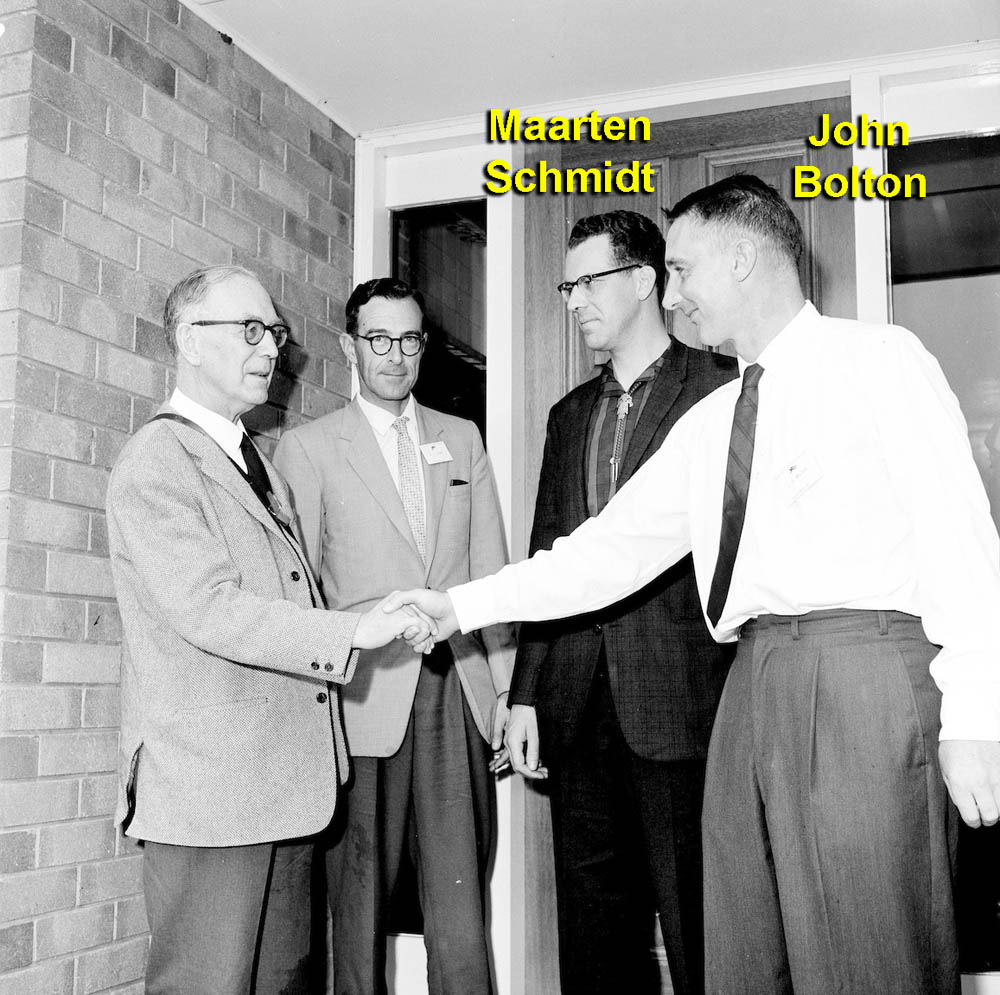
John Bolton greeting delegates with Maarten Schmidt.